Concepts and Techniques for 3D-Embedded Treemaps and their Application to Software Visualization
Doctoral Thesis, Digital Engineering Faculty / Hasso Plattner Institute for Digital Engineering, 2024Daniel Limberger
Abstract | BibTeX | DOI | Doctoral Thesis
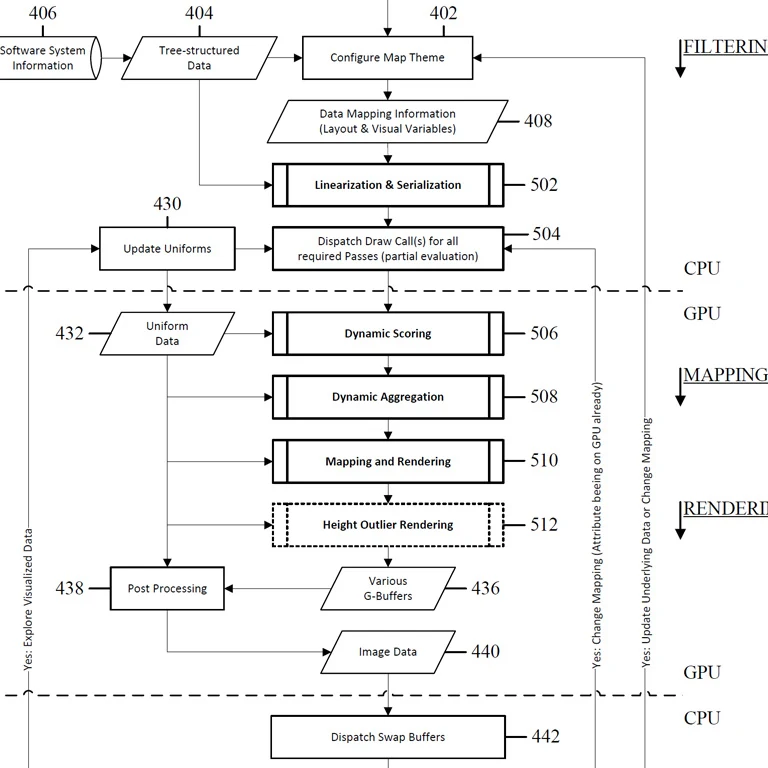
This thesis addresses concepts and techniques for interactive visualization of hierarchical data using treemaps. It explores (1) how treemaps can be embedded in 3D space to improve their information content and expressiveness, (2) how the readability of treemaps can be improved using level-of-detail and degree-of-interest techniques, and (3) how to design and implement a software framework for the real-time web-based rendering of treemaps embedded in 3D. With a particular emphasis on their application, use cases from software analytics are taken to test and evaluate the presented concepts and techniques.
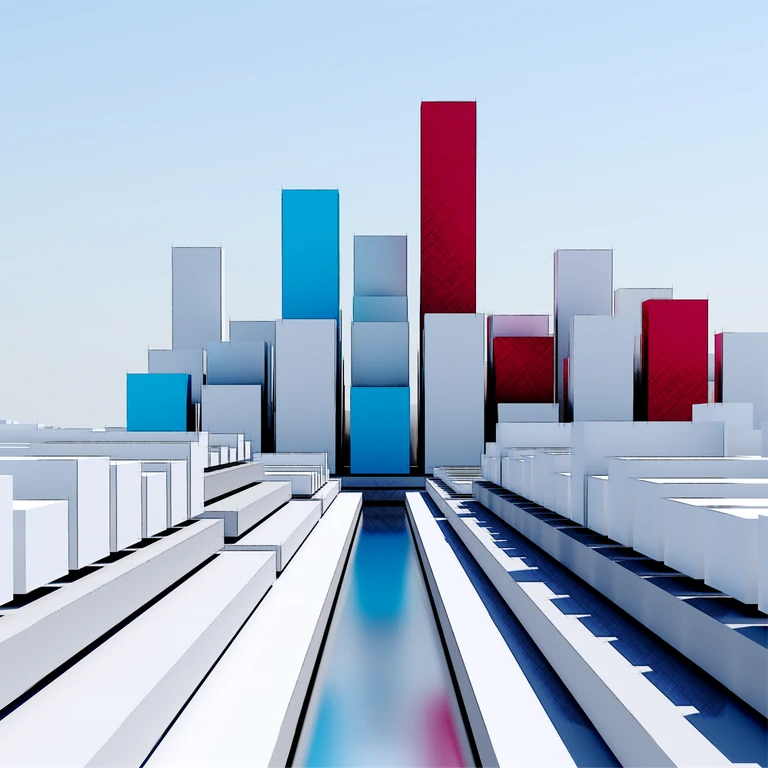
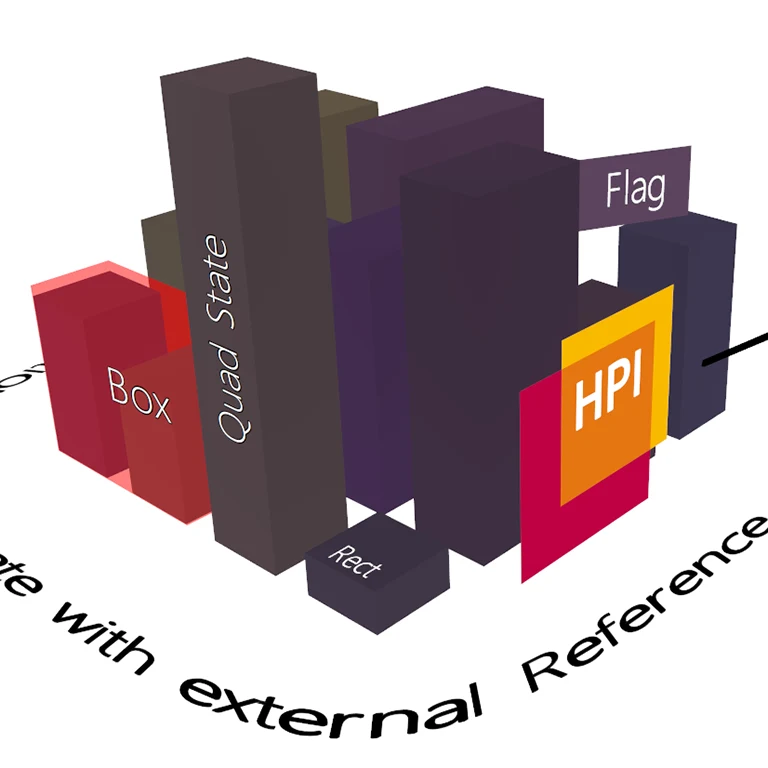
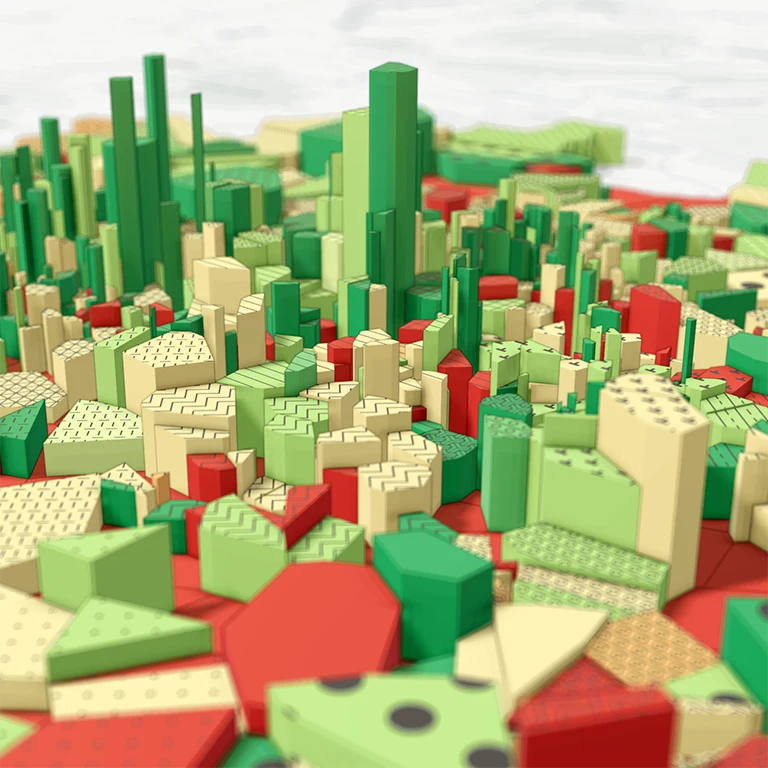
Concerning the first challenge, this thesis shows that a 3D attribute space offers enhanced possibilities for the visual mapping of data compared to classical 2D treemaps. In particular, embedding in 3D allows for improved implementation of visual variables (e.g., by sketchiness and color weaving), provision of new visual variables (e.g., by physically based materials and in situ templates), and integration of visual metaphors (e.g., by reference surfaces and renderings of natural phenomena) into the three-dimensional representation of treemaps.
For the second challenge—the readability of an information visualization—the work shows that the generally higher visual clutter and increased cognitive load typically associated with three-dimensional information representations can be kept low in treemap-based representations of both small and large hierarchical datasets. By introducing an adaptive level-of-detail technique, we cannot only declutter the visualization results, thereby reducing cognitive load and mitigating occlusion problems, but also summarize and highlight relevant data. Furthermore, this approach facilitates automatic labeling, supports the emphasis on data outliers, and allows visual variables to be adjusted via degree-of-interest measures.
The third challenge is addressed by developing a real-time rendering framework with WebGL and accumulative multi-frame rendering. The framework removes hardware constraints and graphics API requirements, reduces interaction response times, and simplifies high-quality rendering. At the same time, the implementation effort for a web-based deployment of treemaps is kept reasonable.
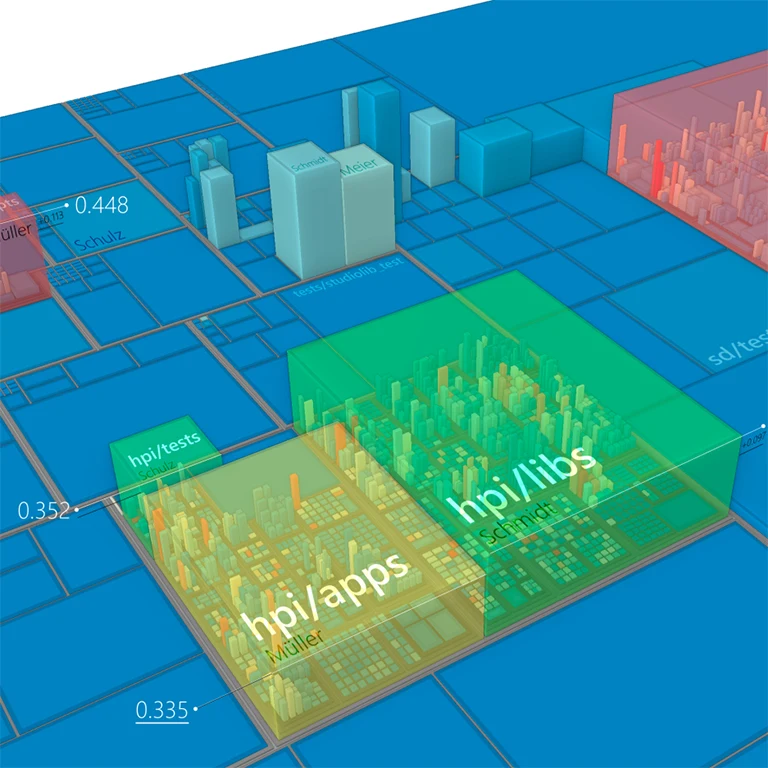
The presented visualization concepts and techniques are applied and evaluated for use cases in software analysis. In this domain, data about software systems, especially about the state and evolution of the source code, does not have a descriptive appearance or natural geometric mapping, making information visualization a key technology here. In particular, software source code can be visualized with treemap-based approaches because of its inherently hierarchical structure. With treemaps embedded in 3D, we can create interactive software maps that visually map, software metrics, software developer activities, or information about the evolution of software systems alongside their hierarchical module structure.
Discussions on remaining challenges and opportunities for future research for 3D-embedded treemaps and their applications conclude the thesis.
@phdthesis{limberger2024-embedded-treemaps,
  author = {Daniel Limberger},
  title = {Concepts and techniques for 3D-embedded treemaps and their application to software visualization},
  type = {doctoralthesis},
  pages = {xi, 118},
  school = {Universit{\"a}t Potsdam},
  doi = {10.25932/publishup-63201},
  year = {2024},
}
Visualization of Source Code Similarity using 2.5D Semantic Software Maps
VISIGRAPP 2021: Computer Vision, Imaging and Computer Graphics Theory and Applications, 2023Daniel Atzberger, Tim Cech, Willy Scheibel, Daniel Limberger, and Jürgen Döllner
Abstract | BibTeX | DOI | Paper
For various program comprehension tasks, software visualization techniques can be beneficial by displaying aspects related to the behavior, structure, or evolution of software. In many cases, the question is related to the semantics of the source code files, e.g., the localization of files that implement specific features or the detection of files with similar semantics. This work presents a general software visualization technique for source code documents, which uses 3D glyphs placed on a two-dimensional reference plane. The relative positions of the glyphs captures their semantic relatedness. Our layout originates from applying Latent Dirichlet Allocation and Multidimensional Scaling on the comments and identifier names found in the source code files. Though different variants for 3D glyphs can be applied, we focus on cylinders, trees, and avatars. We discuss various mappings of data associated with source code documents to the visual variables of 3D glyphs for selected use cases and provide details on our visualization system.
@inproceedings{atzberger2023-code-similarity,
  author = {Atzberger, Daniel and Cech, Tim and Scheibel, Willy and Limberger, Daniel and D{\"o}llner, J{\"u}rgen},
  title = {Visualization of Source Code Similarity using 2.5D Semantic Software Maps},
  booktitle = {VISIGRAPP 2021: Computer Vision, Imaging and Computer Graphics Theory and Applications},
  year = {2023},
  publisher = {Springer},
}
Hardware-accelerated Rendering of Web-based 3D Scatter Plots with Projected Density Fields and Embedded Controls
Proc. ACM Int. Conf. on Web3D Technology (Web3D), 2022, Best PaperLukas Wagner, Daniel Limberger, Willy Scheibel, and Jürgen Döllner
Abstract | BibTeX | DOI | Paper
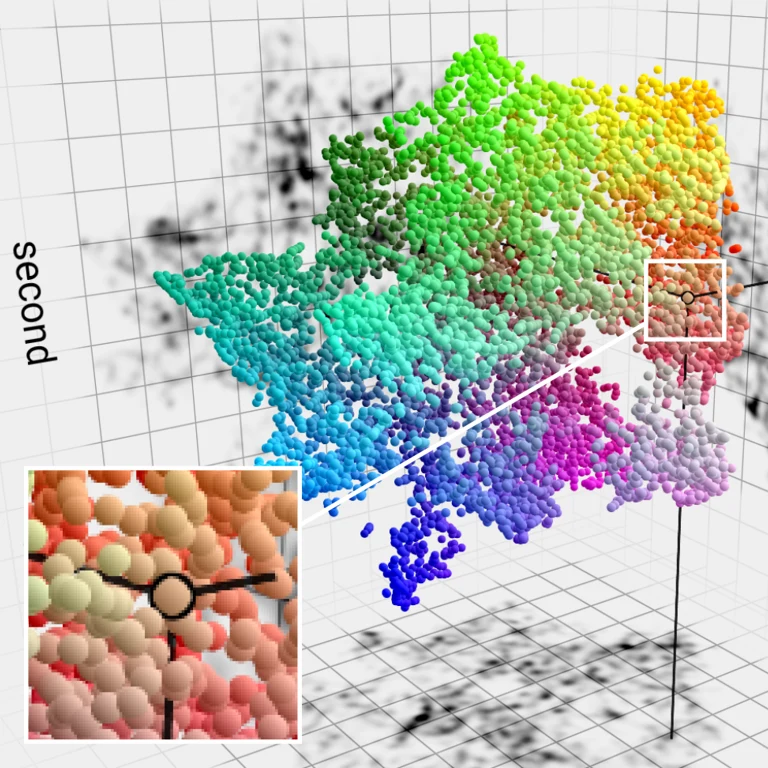
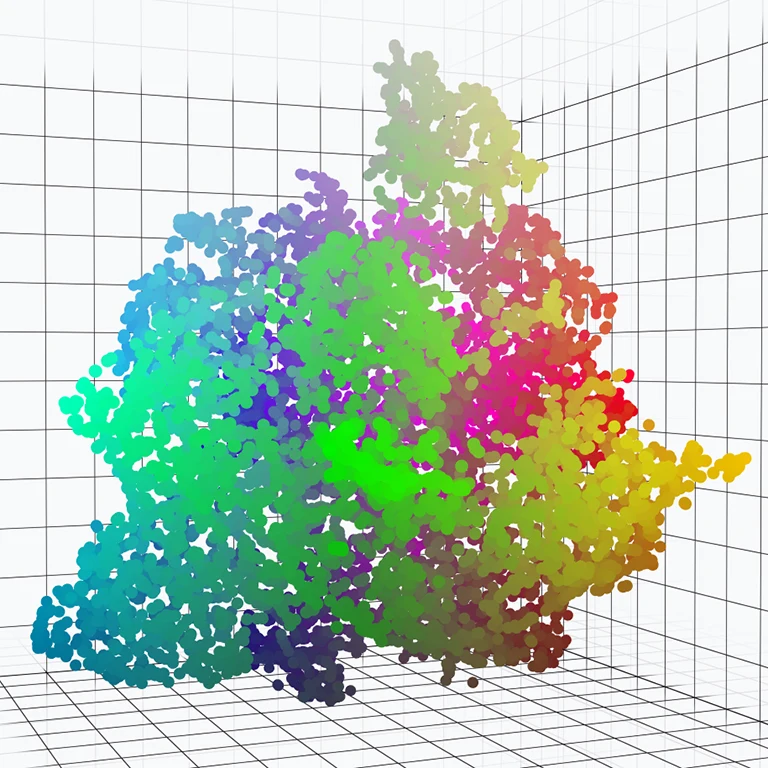
3D scatter plots depicting massive data suffer from occlusion, which makes it difficult to get an overview and perceive structure. This paper presents a technique that facilitates the comprehension of heavily occluded 3D scatter plots. Data points are projected to axial planes, creating x-ray-like 2D views that support the user in analyzing the data's density and layout. We showcase our open-source web application with a hardware-accelerated rendering component written in WebGL. It allows for interactive interaction, filtering, and navigation with datasets up to hundreds of thousands of nodes. The implementation is detailed and discussed with respect to challenges posed by API and performance limitations.
@inproceedings{wagner2022-scatter-plot-density,
  author = {Wagner, Lukas and Limberger, Daniel and Scheibel, Willy and D{\"o}llner, J{\"u}rgen},
  title = {Hardware-accelerated Rendering of Web-based 3D Scatter Plots with Projected Density Fields and Embedded Controls},
  booktitle = {Proceedings of the 27th International Conference on 3D Web Technology},
  year = {2022},
  series = {Web3D~'22},
  publisher = {ACM},
  doi = {10.1145/3564533.3564566},
  isbn = {978-1-450399-14-2},
}
Procedural Texture Patterns for Encoding Changes in Color in 2.5D Treemap Visualizations
Journal of Visualization, 2022Daniel Limberger, Willy Scheibel, Jan van Dieken, and Jürgen Döllner
Abstract | BibTeX | DOI | Paper
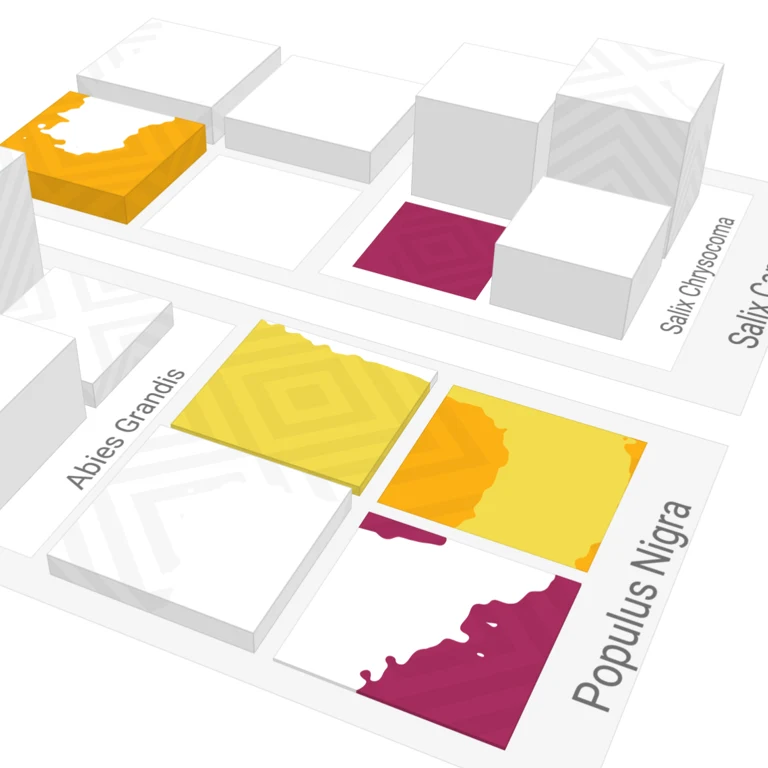
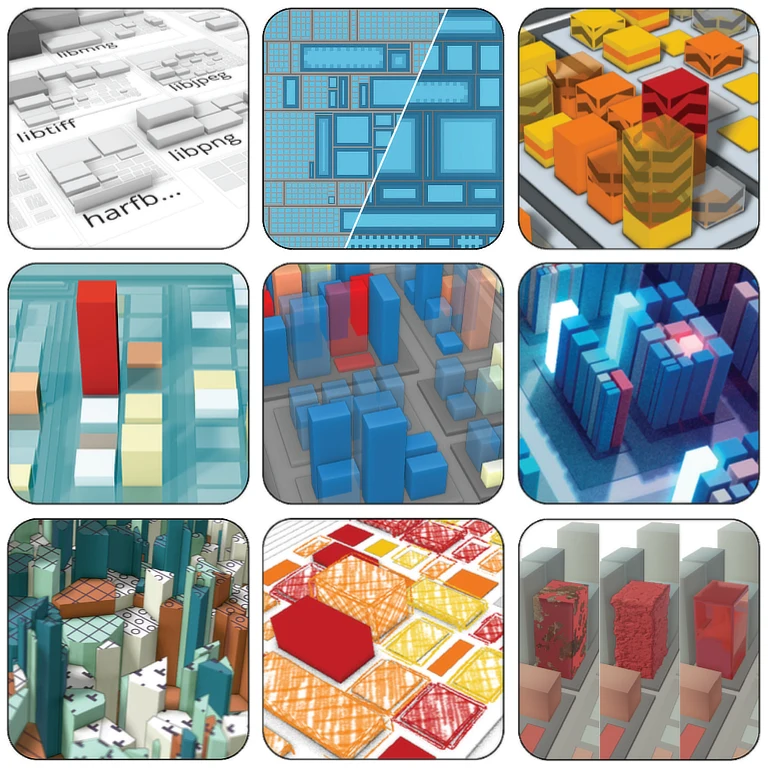
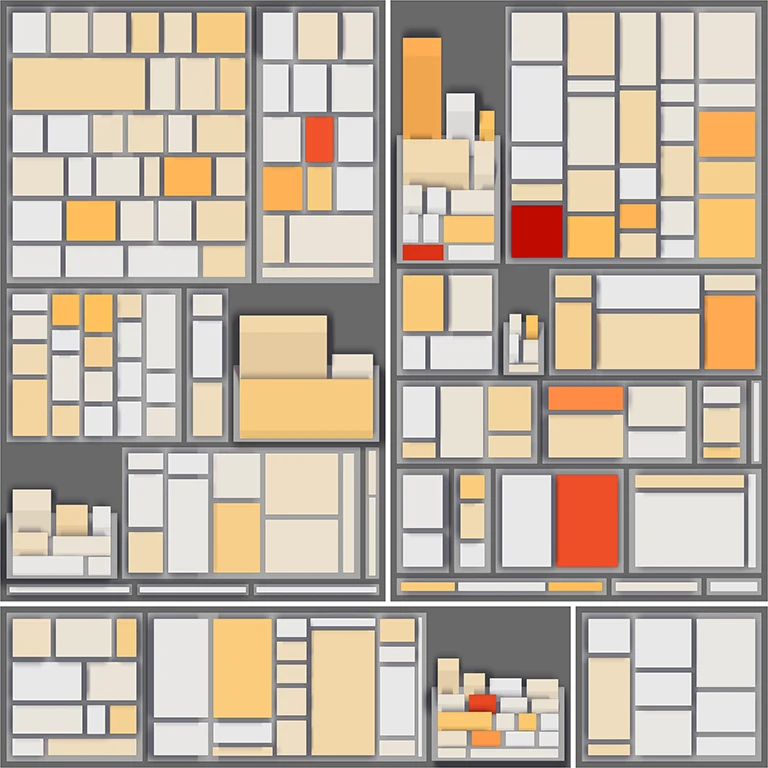
Treemaps depict tree-structured data while maintaining flexibility in mapping data to different visual variables. This work explores how changes in data mapped to color can be represented with rectangular 2.5D treemaps using procedural texture patterns. The patterns are designed to function for both static images and interactive visualizations with animated transitions. During rendering, the procedural texture patterns are superimposed onto the existing color mapping. We present a pattern catalog with seven exemplary patterns having different characteristics in representing the mapped data. This pattern catalog is implemented in a WebGL-based treemap rendering prototype and is evaluated using performance measurements and case studies on two software projects. As a result, this work extends the toolset of visual encodings for 2.5D treemaps by procedural texture patterns to represent changes in color. It serves as a starting point for user-centered evaluation.
@article{limberger2022-changes,
  author = {Limberger, Daniel and Scheibel, Willy and van Dieken, Jan and D{\"o}llner, J{\"u}rgen},
  title = {Procedural Texture Patterns for Encoding Changes in Color in 2.5D Treemap Visualizations},
  journal = {Journal of Visualization},
  year = {2022},
  publisher = {Springer Nature},
  doi = {10.1007/s12650-022-00874-3},
}
Non-Photorealistic Rendering of Point Clouds for Cartographic Visualization
Extended Abstracts of Proc. ICA European Symp. on Cartography (EuroCarto), 2022Ole Wegen, Jürgen Döllner, Ronja Wagner, Daniel Limberger, Rico Richter, and Matthias Trapp
Abstract | BibTeX | DOI | Extended Abstract
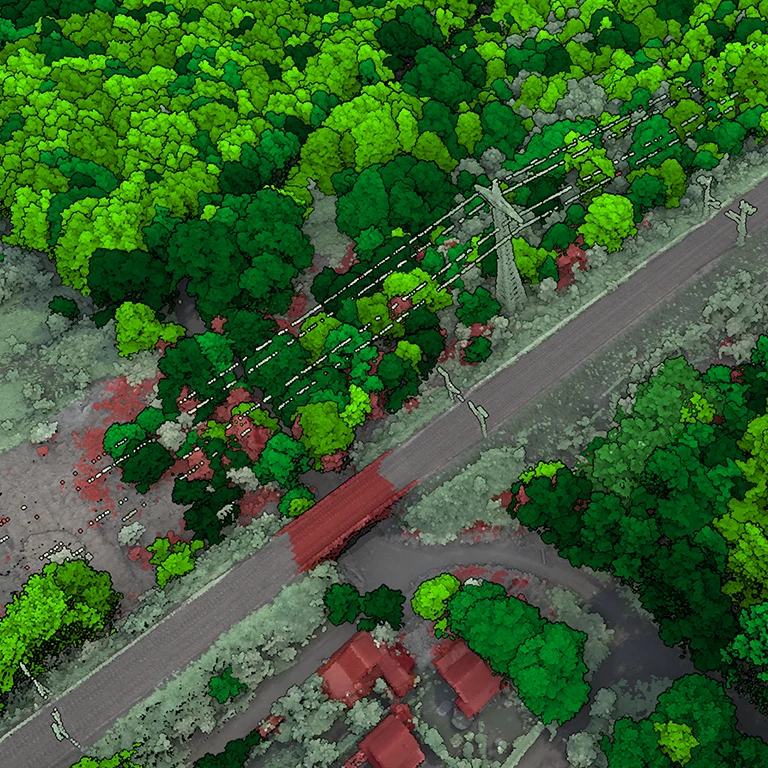
We present an approach for real-time non-photorealistic rendering (NPR) of 3D point clouds that provides a general-purpose component for their cartographic visualization. For a given 3D point cloud, per-point attributes are derived in the preprocessing phase, e.g., for geometric, semantic, and instance information. The point cloud thus attributed is then segmented into point clusters according to thematic or semantic criteria. Different NPR styles configured by style descriptors can be bound to this information, i.e., the NPR style is parameterized by the point attributes found in the clusters. The approach demonstrates that NPR applied to an enriched, clustered point cloud enables a generalized, abstract, and graphically styled visualization without the need to derive intermediate 3D representations. We have implemented, as a proof-of-concept, several styles and mappings typically required for cartographic 3D visualizations.
@inproceedings{wegen2022-pointcloud-cartography,
  author = {Wegen, Ole and D{\"o}llner, J{\"u}rgen and Wagner, Ronja and Limberger, Daniel and Richter, Rico and Trapp, Matthias},
  title = {Non-Photorealistic Rendering of Point Clouds for Cartographic Visualization},
  booktitle = {Extended Abstracts of Proceedings of the 1st ICA European Symposium on Cartography},
  year = {2022},
  series = {EuroCarto~'22},
  publisher = {ICA},
}
Visual Variables and Configuration of Software Maps
Journal of Visualization, 2022Daniel Limberger, Willy Scheibel, Jürgen Döllner, and Matthias Trapp
Abstract | BibTeX | DOI | Paper
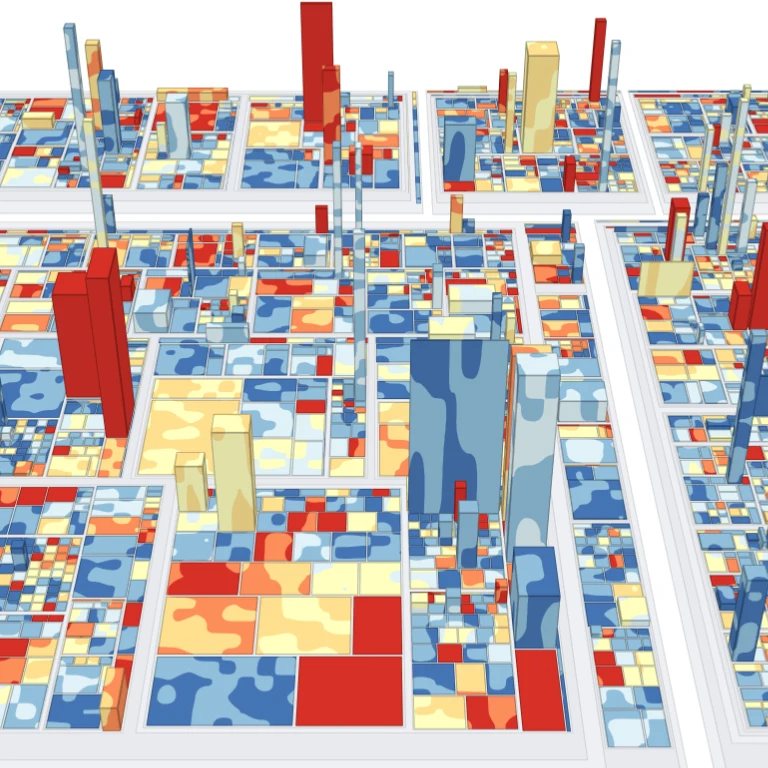
Software maps provide a general-purpose interactive user interface and information display in software analytics. This paper classifies software maps as a containment-based treemap embedded into a 3D attribute space and introduces respective terminology. It provides a comprehensive overview of advanced visual metaphors and techniques, each suitable for interactive visual analytics tasks. The metaphors and techniques are briefly described, located within a visualization pipeline model, and considered within a software map design space. The general expressiveness and applicability of visual variables are detailed and discussed. Consequent applications and use cases for different software system data and software engineering data are discussed, arguing for the versatile use of software maps in visual software analytics.
@article{limberger2022-visvars,
  author = {Limberger, Daniel and Scheibel, Willy and D{\"o}llner, J{\"u}rgen and Trapp, Matthias},
  title = {Visual Variables and Configuration of Software Maps},
  journal = {Journal of Visualization},
  year = {2022},
  publisher = {Springer Nature},
  doi = {10.1007/s12650-022-00868-1},
}
A Benchmark for the Use of Topic Models for Text Visualization Tasks
Proc. ACM Int. Symp. on Visual Information Communication and Interaction (VINCI), 2022Daniel Atzberger, Tim Cech, Willy Scheibel, Daniel Limberger, Jürgen Döllner, and Matthias Trapp
Abstract | BibTeX | DOI | Paper
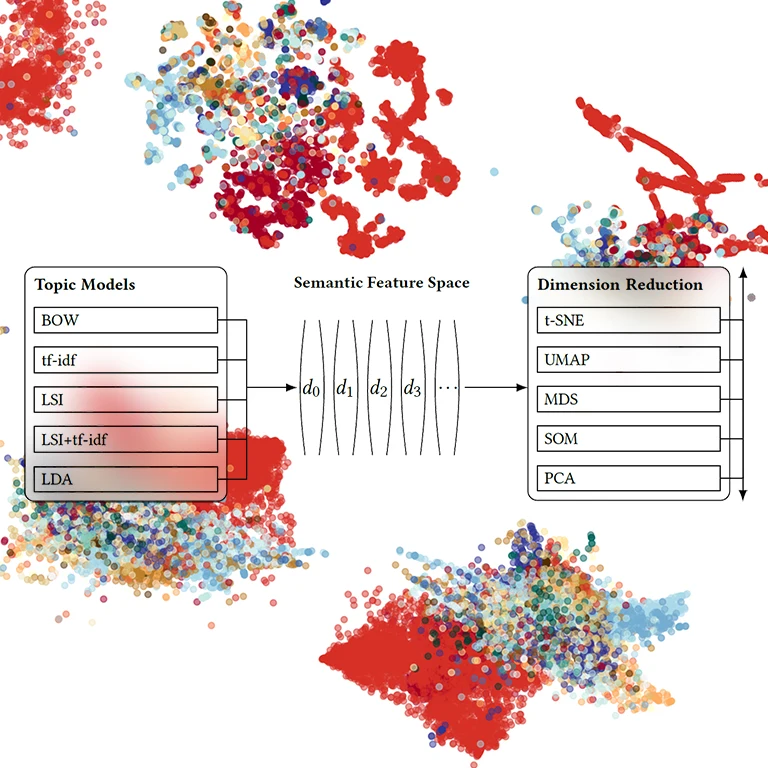
Based on the assumption that semantic relatedness between documents is reflected in the distribution of the vocabulary, topic models are a widely used technique for different analysis tasks. Their application results in concepts, the so-called topics, and a high-dimensional description of the documents. For visualization tasks, they can further be projected onto a lower-dimensional space using a dimension reduction technique. Though the quality of the resulting scatter plot mainly depends on the chosen layout technique and the choice of its hyperparameters, it is unclear which particular combinations of topic models and dimension reduction techniques are suitable for displaying the semantic relatedness between the documents. In this work, we propose a benchmark comprising various datasets, layout techniques, and quality metrics for conducting an empirical study on different such layout algorithms.
@InProceedings{atzberger2022-topicmodel-benchmark,
  author    = {Atzberger, Daniel and Cech, Tim and Scheibel, Willy and Limberger, Daniel and D{\"o}llner, J{\"u}rgen and Trapp, Matthias},
  title     = {A Benchmark for the Use of Topic Models for Text Visualization Tasks},
  booktitle = {Proceedings of the 15th International Symposium on Visual Information Communication and Interaction},
  year      = {2022},
  series    = {VINCI~'22},
  publisher = {ACM},
}
Mining Developer Expertise from Bug Tracking Systems using the Author-Topic Model
Proc. Int. Conf. on Evaluation of Novel Approaches to Software Engineering (ENASE), 2022, Best Student PaperDaniel Atzberger, Jonathan Schneider, Willy Scheibel, Daniel Limberger, Matthias Trapp, and Jürgen Döllner
Abstract | BibTeX | DOI | Paper
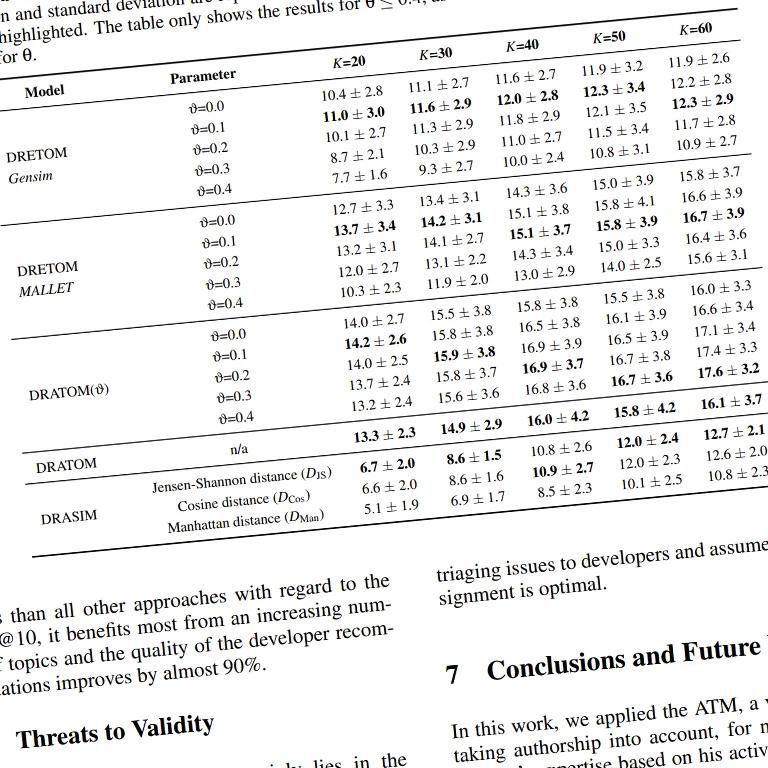
During the software development process, software defects, so-called bugs, are captured in a semi-structured manner in a bug tracking system using textual components and categorical features. It is the task of the triage owner to assign open bugs to developers with the required skills and expertise. This task, known as bug triaging, requires in-depth knowledge about a developer's skills. Various machine learning techniques have been proposed to automate this task, most of these approaches apply topic models, especially Latent Dirichlet Allocation, for mining the textual components of bug reports. However, none of the proposed approaches explicitly models a developer's expertise. In most cases, these algorithms are treated as a black box, as they allow no explanation about their recommendation. In this work, we show how the Author-Topic Model, a variant of Latent Dirichlet Allocation, can be used to capture a developer's expertise in the latent topics of a corpus of bug reports from the model itself. Furthermore, we present three novel bug triaging techniques based on the Author-Topic Model. We compare our approach against a baseline model, that is based on Latent Dirichlet Allocation, on a dataset of 18269 bug reports from the Mozilla Firefox project collected between July 1999 to June 2016. The results show that the Author-Topic Model can outperform the baseline approach in terms of the Mean Reciprocal Rank.
@inproceedings{atzberger2022-mining-expertise,
  author = {Atzberger, Daniel and Schneider, Jonathan and Scheibel, Willy and Limberger, Daniel and Trapp, Matthias and D{\"o}llner, J{\"u}rgen},
  title = {Mining Developer Expertise from Bug Tracking Systems using the Author-Topic Model},
  booktitle = {Proceedings of the 17th International Conference on Evaluation of Novel Approaches to Software Engineering - ENASE},
  year = {2022},
  series = {ENASE~'22},
  publisher = {SciTePress},
  organization = {INSTICC},
  pages = {107--118},
  doi = {10.5220/0011045100003176},
  isbn = {978-9-897585-68-5},
}
Augmenting Library Development by Mining Usage Data from Downstream Dependencies
Proc. Int. Conf. on Evaluation of Novel Approaches to Software Engineering (ENASE), 2022Christoph Thiede, Willy Scheibel, Daniel Limberger, and Jürgen Döllner
Abstract | BibTeX | DOI | Paper | Project Page | Sources
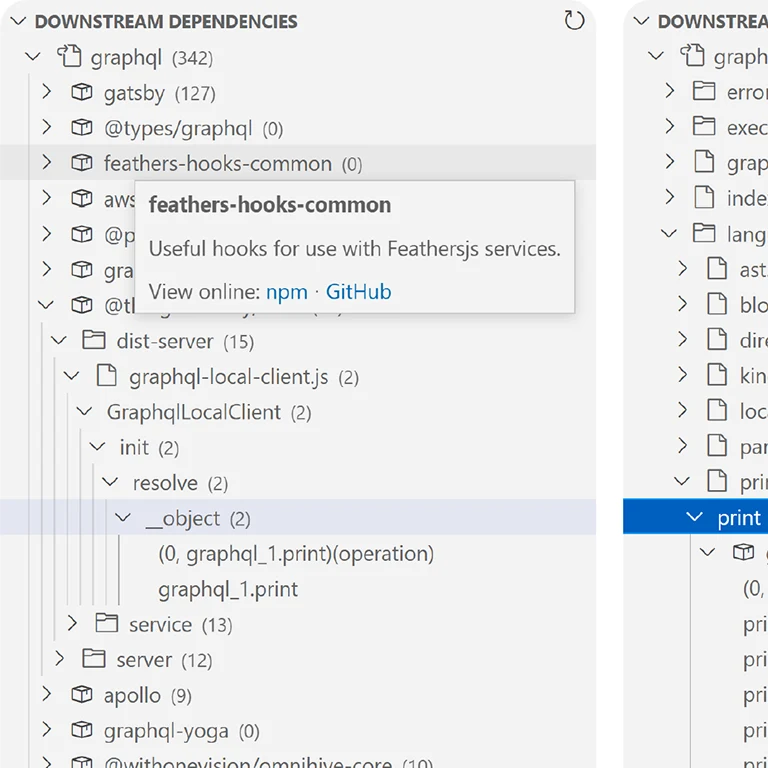
In the dependency graph of a software ecosystem, downstream dependencies are the nodes that depend on a package. Apart from end-user APIs, these dependencies make up the bulk of a library's usage for most packages. Other than for upstream dependencies, tools that provide individual package developers with this kind of information rarely exist to date. This paper proposes methods for (1) efficiently gathering downstream dependencies of a single package and (2) extracting usage samples from them using a static type analyzer. It also presents a tool that allows developers of \emph{npm} packages to explore the aggregated usage data directly in their IDE, i.e., Visual Studio Code, in an interactive and context-sensitive way. The tool exposes which other packages rely on specific functions and, more interestingly, why and how the package's functions are used. This can help prioritize and steer development and uncover unexpected usage patterns, inappropriate function signatures, or misleading interface design. Our methods return over 8000 dependencies for popular packages with an average precision of \SI{98.7}{\percent} and \SI{68.4}{\percent}, respectively, but tend to exclude unpopular dependencies. Usage pattern extraction is very precise but not easily available for repositories with complex build configurations or metaprogramming patterns. We show that usage data from downstream dependency repositories is a promising and diverse source of information for mining software repositories and that our approach supports package developers in maintain their APIs.
@inproceedings{thiede2022-downstream-mining,
  author = {Thiede, Christoph and Scheibel, Willy and Limberger, Daniel and D{\"o}llner, J{\"u}rgen},
  title = {Augmenting Library Development by Mining Usage Data from Downstream Dependencies},
  booktitle = {Proceedings of the 17th International Conference on Evaluation of Novel Approaches to Software Engineering - ENASE},
  year = {2022},
  series = {ENASE~'22},
  publisher = {SciTePress},
  organization = {INSTICC},
  pages = {221--232},
  doi = {10.5220/0011093700003176},
  isbn = {978-9-897585-68-5},
}
A Non-Photorealistic Rendering Technique for Art-directed Hatching of 3D Point Clouds
Proc. Int. Conf. on Computer Graphics Theory and Applications (GRAPP), 2022Ronja Wagner, Ole Wegen, Daniel Limberger, Jürgen Döllner, and Matthias Trapp
Abstract | BibTeX | DOI | Paper | Slides
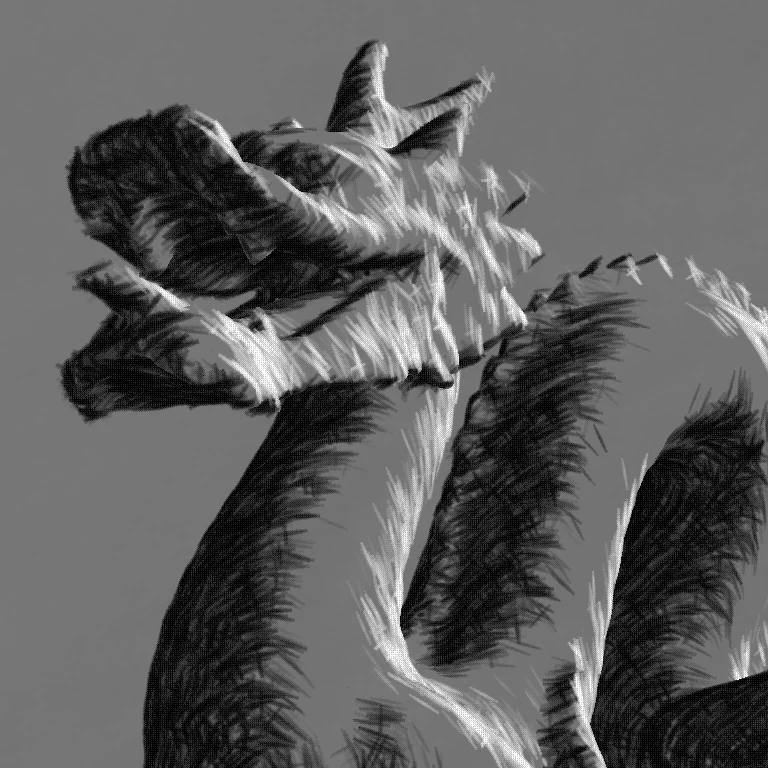
Point clouds or point-based geometry of varying density can nowadays be easily acquired using LiDAR cameras or modern smartphones with LiDAR sensors. We demonstrate how this data can be used directly to create novel artistic digital content using Non-Photorealistic Rendering techniques. We introduce a GPU-based technique for art-directable NPR rendering of 3D point clouds at interactive frame-rates. The technique uses either a subset or all of the points to generate oriented, sketchy strokes by taking local curvature and normal information into account. It uses X-Toon textures as part of its parameterization, supports hatching and cross hatching, and is inherently temporal coherent with respect to virtual camera movements. This introduces significant artistic freedom that is underlined by our results, which show that a variety of different sketchy styles such as colored crayons, pencil, pointillism, wax crayons, blue print, and chalk-drawings can be achieved on a wide spectrum of point clouds, i.e., covering 3D polygonal meshes as well as iPad-based LiDAR scans.
@inproceedings{wagner2022-pointcloud-stylization,
  author = {Wagner, Ronja and Wegen, Ole and Limberger, Daniel and D{\"o}llner, J{\"u}rgen and Trapp, Matthias},
  title = {A Non-Photorealistic Rendering Technique for Art-directed Hatching of 3D Point Clouds},
  booktitle = {Proceedings of the 17th International Joint Conference on Computer Vision, Imaging and Computer Graphics Theory and Applications},
  year = {2022},
  series = {GRAPP~'22},
  publisher = {SciTePress},
  pages = {220-227},
  doi = {10.5220/0010849500003124},
  isbn = {978-9-897585-55-5},
}
Visualization of Knowledge Distribution across Development Teams using 2.5D Semantic Software Maps
Proc. Int. Conf. on Information Visualization Theory and Applications (IVAPP), 2022Daniel Atzberger, Tim Cech, Adrian Jobst, Willy Scheibel, Daniel Limberger, Matthias Trapp, and Jürgen Döllner
Abstract | BibTeX | DOI | Paper
In order to detect software risks at an early stage, various software visualization techniques have been developed for monitoring the structure, behaviour, or the underlying development process of software. One of greatest risks for any IT organization consists in an inappropriate distribution of knowledge among its developers, as a projects' success mainly depends on assigning tasks to developers with the required skills and expertise. In this work, we address this problem by proposing a novel Visual Analytics framework for mining and visualizing the expertise of developers based on their source code activities. Under the assumption that a developer's knowledge about code is represented directly through comments and the choice of identifier names, we generate a 2D layout using Latent Dirichlet Allocation together with Multidimensional Scaling on the commit history, thus displaying the semantic relatedness between developers. In order to capture a developer's expertise in a concept, we utilize Labeled LDA trained on a corpus of Open Source projects. By mapping aspects related to skills onto the visual variables of 3D glyphs, we generate a 2.5D Visualization, we call KnowhowMap. We exemplify this approach with an interactive prototype that enables users to analyze the distribution of skills and expertise in an explorative way.
@inproceedings{atzberger2022-knowhow-map,
  author = {Atzberger, Daniel and Cech, Tim and Jobst, Adrian and Scheibel, Willy and Limberger, Daniel and Trapp, Matthias and D{\"o}llner, J{\"u}rgen},
  title = {Visualization of Knowledge Distribution across Development Teams using 2.5D Semantic Software Maps},
  booktitle = {Proceedings of the 17th International Joint Conference on Computer Vision, Imaging and Computer Graphics Theory and Applications - IVAPP},
  year = {2022},
  series = {IVAPP~'22},
  publisher = {SciTePress},
  pages = {210--217},
  doi = {10.5220/0010991100003124},
  isbn = {978-9-897585-55-5},
}
Interactive Volumetric Region Growing for Brain Tumor Segmentation on MRI using WebGL
Proc. ACM Int. Conf. on Web3D Technology (Web3D), 2021Jonas Kordt, Paul Brachmann, Daniel Limberger, and Christoph Lippert
Abstract | BibTeX | DOI | Paper
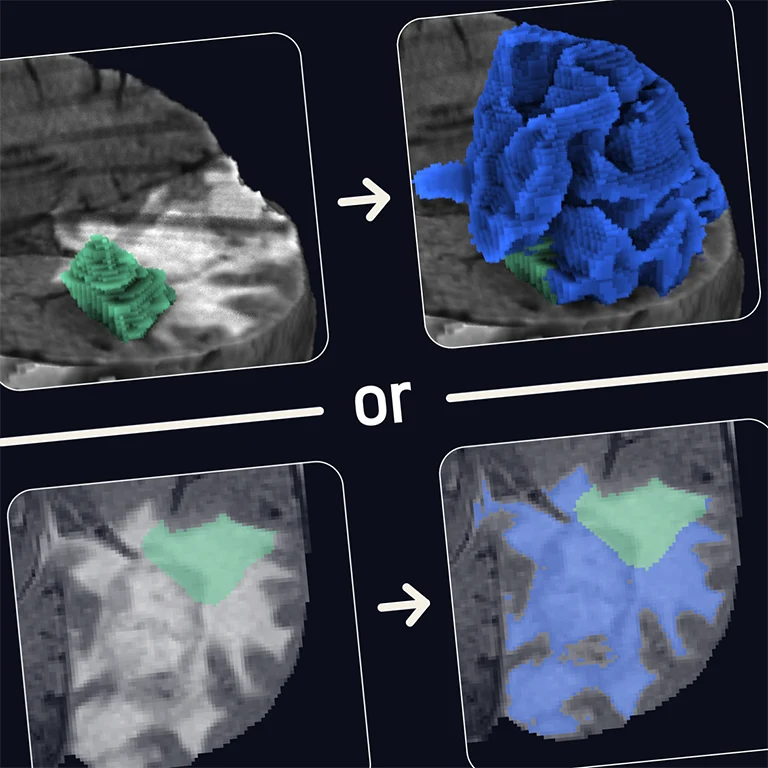
Volumetric segmentation of medical images is an essential tool in treatment planning and many longitudinal studies. While machine learning approaches promise to fully automate it, they most often still depend on manually labeled training data. We thus present a GPU-based volumetric region growing approach for semi-automatic brain tumor segmentation that can be interactively tuned. Additionally, we propose multidimensional transfer functions for ray tracing that allow users to judge the quality of the grown region. Our implementation produces a full brain tumor segmentation within a few milliseconds on consumer hardware. The visualization uses adaptive resolution scaling and progressive, asynchronous shading computation to maintain a stable 60 Hz refresh rate.
@inproceedings{kordt2021-tumor-segmentation,
  author = {Kordt, Jonas and Brachmann, Paul and Limberger, Daniel and Lippert, Christoph},
  title = {Interactive Volumetric Region Growing for Brain Tumor Segmentation on MRI Using WebGL},
  booktitle = {Proceedings of the 26th International Conference on 3D Web Technology},
  year = {2021},
  series = {Web3D~'21},
  publisher = {ACM},
  pages = {2:1--8},
  doi = {10.1145/3485444.3487640},
  isbn = {978-1-450390-95-8},
}
Interactive Simulation and Visualization of Long-Term, ETF-based Investment Strategies
Proc. ACM Int. Symp. on Visual Information Communication and Interaction (VINCI), 2021Martin Büßemeyer, Daniel Limberger, Willy Scheibel, and Jürgen Döllner
Abstract | BibTeX | DOI | Paper
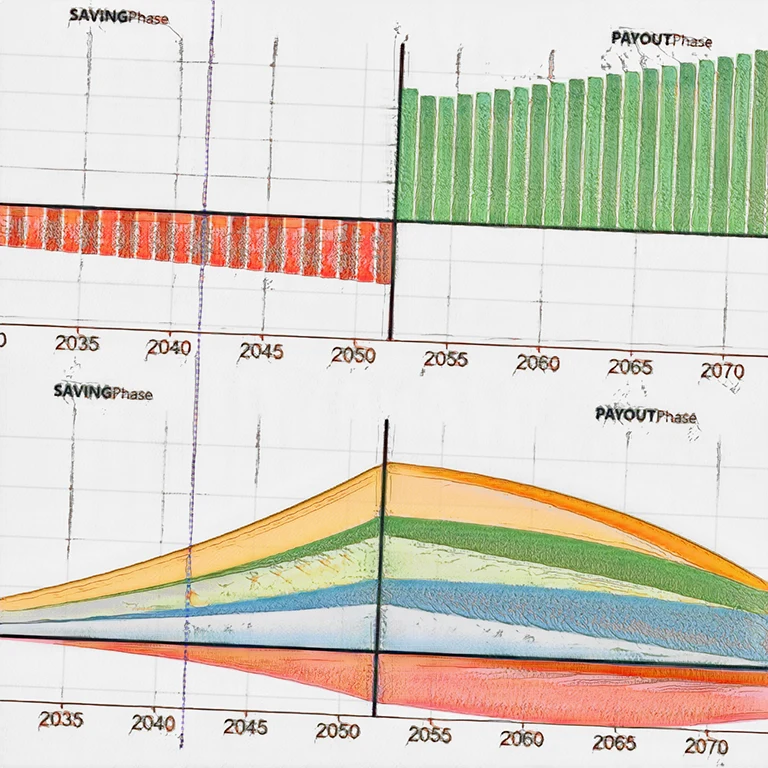
Personal, long-term investment products, especially ones for retirement savings, require thorough understanding to use them profitably. Even simple savings plans based on exchange-traded funds (ETFs) are subject to many variables and uncertainties to be considered for expected and planned-upon returns. We present aninteractive simulation of an ETF-based savings plan that combinesforecasts, risk awareness, taxes and costs, inflation, and dynamicinflows and outflows into a single visualization. The visualization consists of four parts; a form-fill interface for configuration, a savings and payout simulation, a cash flow chart, and a savings chart. Based on a specific use case, we discuss how private investors canbenefit from using our visualization after a short training period.
@inproceedings{buessemeyer2021-etf-visualization,
  author = {B{\"u}{\"s}emeyer, Martin, and Limberger, Daniel and Scheibel, Willy and D{\"o}llner, J{\"u}rgen},
  title = {Interactive Simulation and Visualization of Long-Term, ETF-based Investment Strategies},
  booktitle = {Proceedings of the 14th International Symposium on Visual Information Communication and Interaction},
  year = {2021},
  series = {VINCI~'21},
  publisher = {ACM},
  doi = {10.1145/3481549.3481568},
  isbn = {978-1-450386-47-0},
}
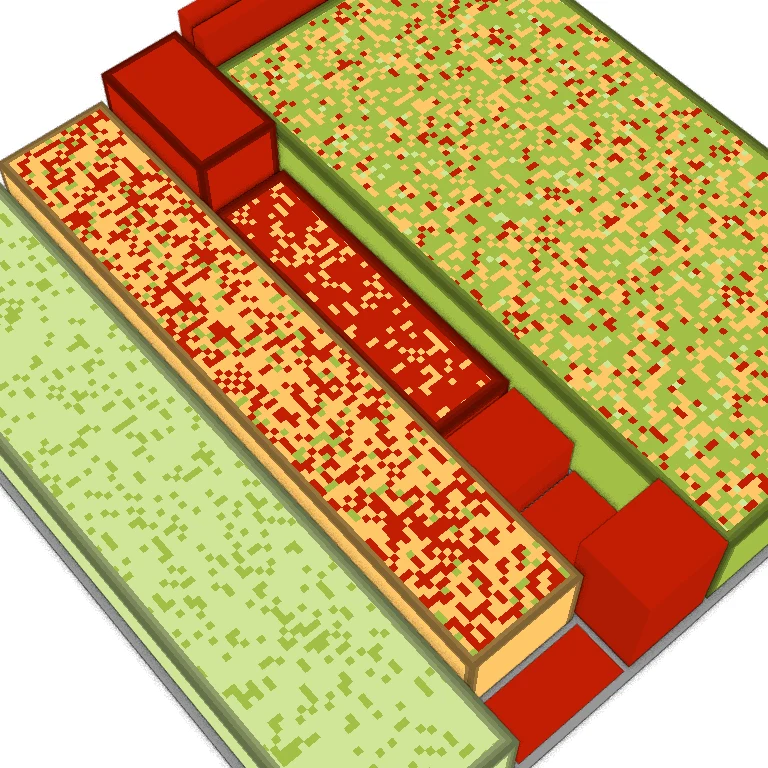
Visualization of Data Changes in 2.5D Treemaps using Procedural Textures and Animated Transitions
Proc. ACM Int. Symp. on Visual Information Communication and Interaction (VINCI), 2021Daniel Limberger, Willy Scheibel, Jan Dieken, and Jürgen Döllner
Abstract | BibTeX | DOI | Paper
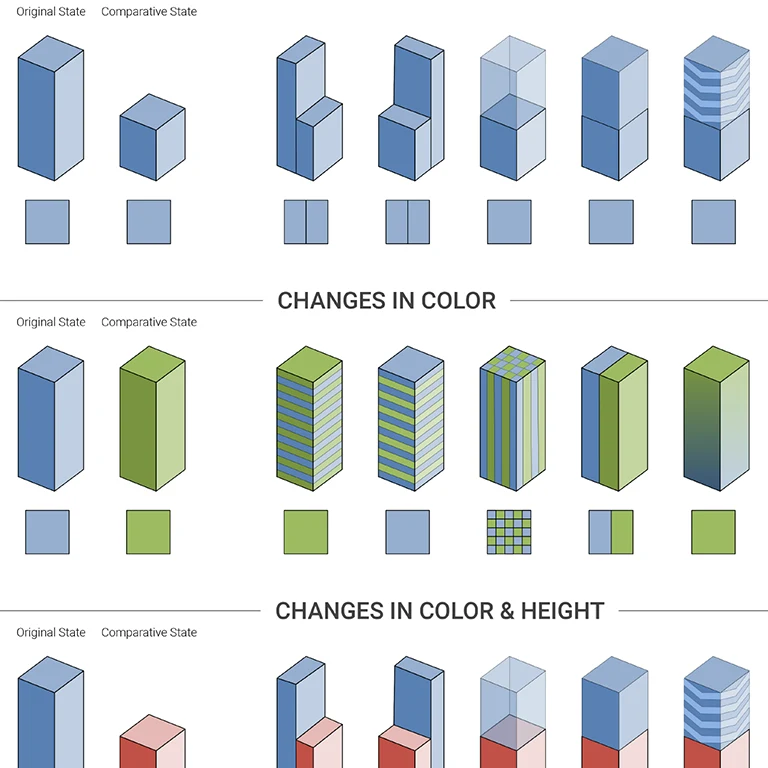
This work investigates the extent to which animated procedural texture patterns can be used to support the representation of changes in 2.5D treemaps. Changes in height, color, and area of individual nodes can easily be visualized using animated transitions. Especially for changes in the color attribute, plain animated transitions are not able to directly communicate the direction of change itself. We show how procedural texture patterns can be superimposed to the color mapping and support transitions. To this end, we discuss qualitative properties of each pattern, demonstrate their ability to communicate change direction both with and without animation, and conclude which of the patterns are more likely to increase effectiveness and correctness of the change mapping in 2.5D treemaps.
@inproceedings{limberger2021-procedural,
  author = {Limberger, Daniel and Scheibel, Willy and Dieken, Jan and D{\"o}llner, J{\"u}rgen},
  title = {Visualization of Data Changes in 2.5D Treemaps using Procedural Textures and Animated Transitions},
  booktitle = {Proceedings of the 14th International Symposium on Visual Information Communication and Interaction},
  year = {2021},
  series = {VINCI~'21},
  publisher = {ACM},
  pages = {21:1--5},
  doi = {10.1145/3481549.3481570},
  isbn = {978-1-450386-47-0},
}
Software Galaxies: Displaying Coding Activities using a Galaxy Metaphor
Proc. ACM Int. Symp. on Visual Information Communication and Interaction (VINCI), 2021Daniel Atzberger, Willy Scheibel, Daniel Limberger, and Jürgen Döllner
Abstract | BibTeX | DOI | Paper
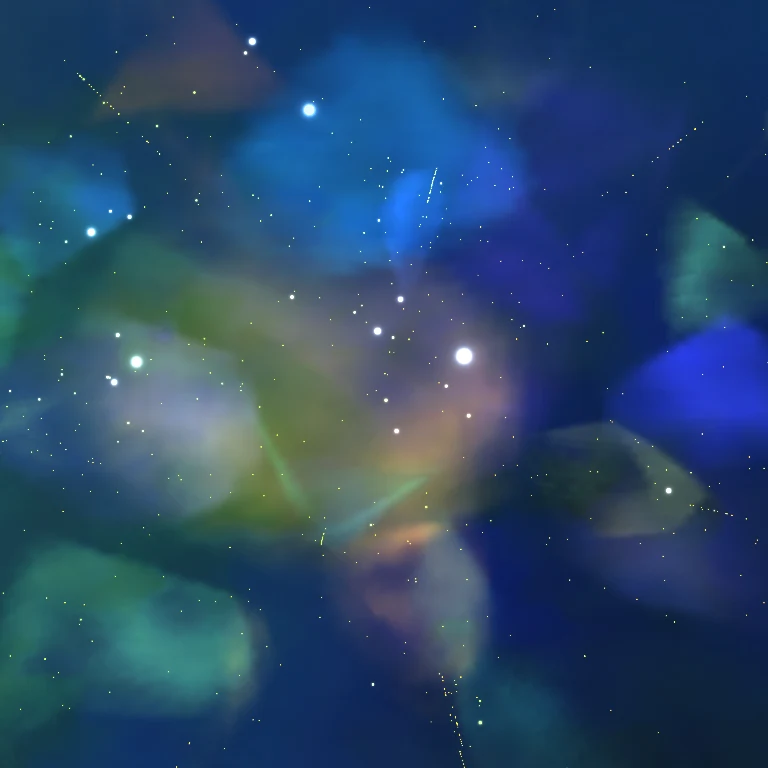
Software visualization uses metaphors to depict software and software development data that usually has no gestalt. The choice of a metaphor and visual depiction is researched broadly, but deriving a layout based on similarity is still challenging. We present a novel approach to 3D software visualization called Software Galaxy. Our layout is based on applying Latent Dirichlet Allocation on source code. We utilize a metaphor inspired from astronomy for depicting software metrics for single files and clusters. Our first experiments indicate that a 3D visualization capturing semantic relatedness can be beneficial for standard program comprehension tasks.
@inproceedings{atzberger2021-software-galaxy,
  author = {Atzberger, Daniel and Scheibel, Willy and Limberger, Daniel and D{\"o}llner, J{\"u}rgen},
  title = {Software Galaxies: Displaying Coding Activities using a Galaxy Metaphor},
  booktitle = {Proceedings of the 14th International Symposium on Visual Information Communication and Interaction},
  year = {2021},
  series = {VINCI~'21},
  publisher = {ACM},
  pages = {24:1--2},
  doi = {10.1145/3481549.3481573},
  isbn = {978-1-450386-47-0},
}
RoomCanvas: A Visualization System for Spatiotemporal Temperature Data in Smart Homes
Proc. EG Int. Conf. on Visualization (EuroVis), 2021Bastian König, Daniel Limberger, Jan Klimke, Benjamin Hagedorn, and Jürgen Döllner
Abstract | BibTeX | DOI | Paper | Demo
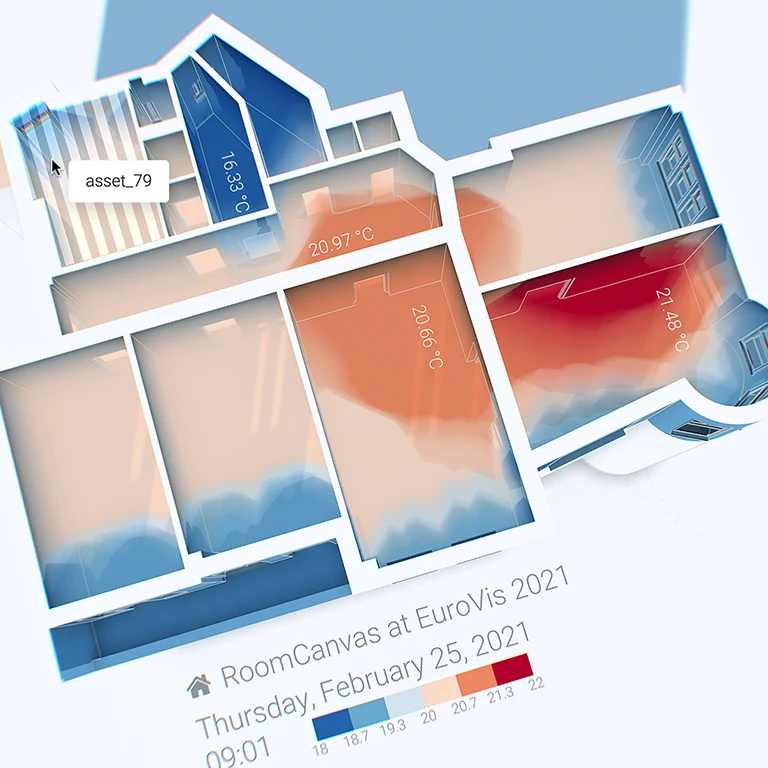
Spatiotemporal measurements such as power consumption, temperature, humidity, movement, noise, brightness, etc., will become ubiquitously available in both old and modern homes to capture and analyze behavioral patterns. The data is fed into analytics platforms and tapped by services but is generally not readily available to consumers for exploration due in part to its inherent complexity and volume. We present an interactive visualization system that uses a simplified 3D representation of building interiors as a canvas for a unified sensor data display. The system’s underlying visualization supports spatial as well as temporal accumulation of data, e.g., temperature and humidity values. It introduces a volumetric data interpolation approach which takes 3D room boundaries such as walls, doors, and windows into account. We showcase an interactive, web-based prototype that allows for the exploration of historical as well as real-time data of multiple temperature and humidity sensors. Finally, we sketch an integrated pipeline from sensor data acquisition to visualization, discuss the creation of semantic geometry and subsequent preprocessing, and provide insights into our real-time rendering implementation.
@inproceedings{koenig2021-roomcanvas,
  author = {K{\"o}nig, Bastian and Limberger, Daniel and Klimke, Jan and Hagedorn, Benjamin and D{\"o}llner, J{\"u}rgen},
  title = {RoomCanvas: A Visualization System for Spatiotemporal Temperature Data in Smart Homes},
  booktitle = {EuroVis 2021 - Short Papers},
  year = {2021},
  series = {EuroVis~'21},
  publisher = {EG},
  pages = {13--17},
  doi = {10.2312/evs.20211048},
  isbn = {978-3-038681-43-4},
}
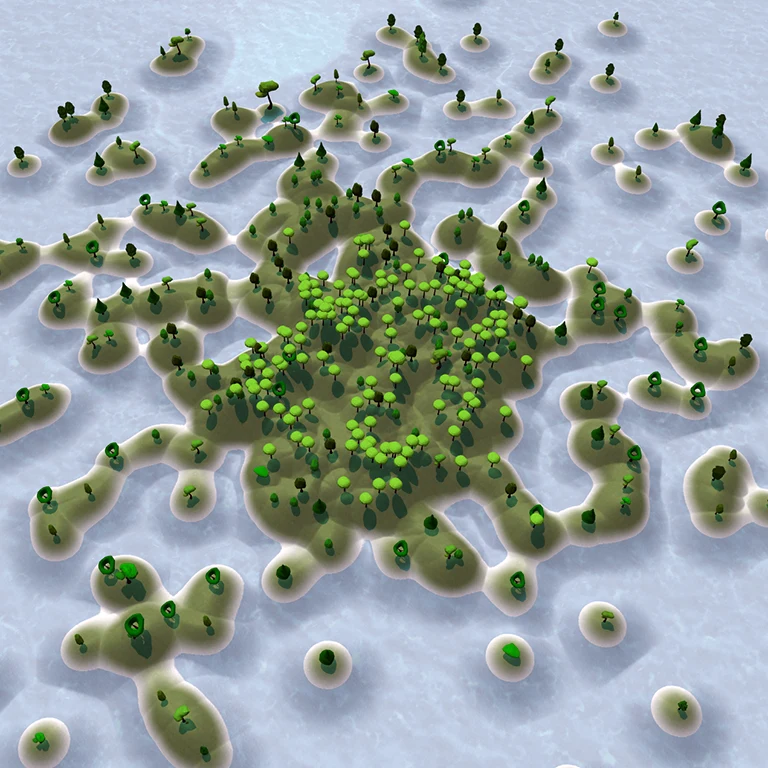
Software Forest: A Visualization of Semantic Similarities in Source Code using a Tree Metaphor
Proc. Int. Conf. on Information Visualization Theory and Applications (IVAPP), 2021Daniel Atzberger, Tim Cech, Merlin de la Haye, Maximilian Söchting, Willy Scheibel, Daniel Limberger, and Jürgen Döllner
Abstract | BibTeX | DOI | Paper
Software visualization techniques provide effective means for program comprehension tasks as they allow developers to interactively explore large code bases. A frequently encountered task during software development is the detection of source code files of similar semantic. To assist this task we present Software Forest, a novel 2.5D software visualization that enables interactive exploration of semantic similarities within a software system, illustrated as a forest. The underlying layout results from the analysis of the vocabulary of the software documents using Latent Dirichlet Allocation and Multidimensional Scaling and therefore reflects the semantic similarity between source code files. By mapping properties of a software entity, e.g., size metrics or trend data, to visual variables encoded by various, figurative tree meshes, aspects of a software system can be displayed. This concept is complemented with implementation details as well as a discussion on applications.
@inproceedings{atzberger2021-software-forest,
  author = {Atzberger, Daniel and Cech, Tim and de la Haye, Merlin and S{\"o}chting, Maximilian and Scheibel, Willy and Limberger, Daniel and D{\"o}llner, J{\"u}rgen},
  title = {Software Forest: A Visualization of Semantic Similarities in Source Code using a Tree Metaphor},
  booktitle = {Proceedings of the 16th International Joint Conference on Computer Vision, Imaging and Computer Graphics Theory and Applications},
  year = {2021},
  series = {IVAPP~'21},
  publisher = {SciTePress},
  pages = {112--122},
  doi = {10.5220/0010267601120122},
  isbn = {978-9-897584-88-6},
}
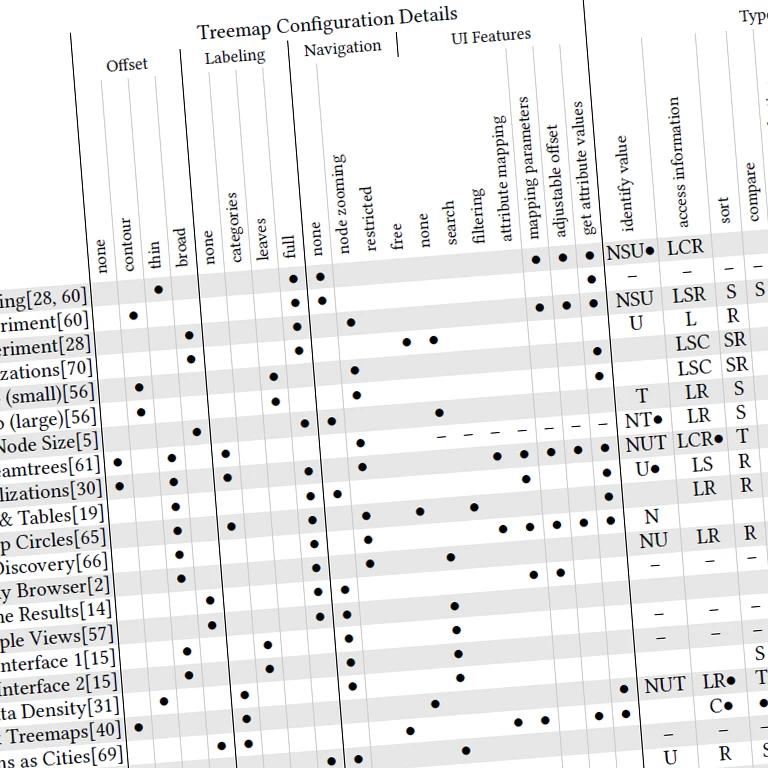
Survey on User Studies on the Effectiveness of Treemaps
Proc. ACM Int. Symp. on Visual Information Communication and Interaction (VINCI), 2020Carolin Fiedler, Willy Scheibel, Daniel Limberger, Matthias Trapp, and Jürgen Döllner
Abstract | BibTeX | DOI | Paper | Website
Treemaps are a commonly used tool for the visual display and communication of tree-structured, multi-variate data. In order to confidently know when and how treemaps can best be applied, the research community uses usability studies and controlled experiments to "understand the potential and limitations of our tools" (Plaisant, 2004). To support the communities' understanding and usage of treemaps, this survey provides a comprehensive review and detailed overview of 69 user studies related to treemaps. However, due to pitfalls and shortcomings in design, conduct, and reporting of the user studies, there is little that can be reliably derived or accepted as a generalized statement. Fundamental open questions include configuration, compatible tasks, use cases, and perceptional characteristics of treemaps. The reliability of findings and statements is discussed and common pitfalls of treemap user studies are identified.
@inproceedings{fiedler2020-treemap-evaluation,
  author = {Fiedler, Carolin and Scheibel, Willy and Limberger, Daniel and Trapp, Matthias and D{\"o}llner, J{\"u}rgen},
  title = {Survey on User Studies on the Effectiveness of Treemaps},
  booktitle = {Proceedings of the 13th International Symposium on Visual Information Communication and Interaction},
  year = {2020},
  series = {VINCI~'20},
  publisher = {ACM},
  pages = {2:1--10},
  doi = {10.1145/3430036.3430054},
  isbn = {978-1-450387-50-7},
}
Survey of Treemap Layout Algorithms
Proc. ACM Int. Symp. on Visual Information Communication and Interaction (VINCI), 2020Willy Scheibel, Daniel Limberger, and Jürgen Döllner
Abstract | BibTeX | DOI | Paper
This paper provides an overview of published treemap layout algorithms from 1991 to 2019 that were used for information visualization and computational geometry. First, a terminology is outlined for the precise communication of tree-structured data and layouting processes. Second, an overview and classification of layout algorithms is presented and application areas are discussed. Third, the use-case-specific adaption process is outlined and discussed. This overview targets practitioners and researchers by providing a starting point for own research, visualization design, and applications.
@inproceedings{scheibel2020-survey-layouts,
  author = {Scheibel, Willy and Limberger, Daniel and D{\"o}llner, J{\"u}rgen},
  title = {Survey of Treemap Layout Algorithms},
  booktitle = {Proceedings of the 13th International Symposium on Visual Information Communication and Interaction},
  year = {2020},
  series = {VINCI~'20},
  publisher = {ACM},
  pages = {1:1--9},
  doi = {10.1145/3430036.3430041},
  isbn = {978-1-450387-50-7},
}
Depicting Uncertainty in 2.5D Treemaps
Proc. ACM Int. Symp. on Visual Information Communication and Interaction (VINCI), 2020Daniel Limberger, Matthias Trapp, and Jürgen Döllner
Abstract | BibTeX | DOI | Paper
A truthful and unbiased display of data using information visualization requires detecting and communicating uncertainty. Uncertainty is often inherent in data or is introduced by data processing and visualization (e.g., visual display of accumulated data) but frequently not accounted for. This paper discusses the suitability of advanced visual variables such as sketchiness, noise, nesting-level contouring, and color weaving for communicating uncertainty.
@inproceedings{limberger2020-uncertainty,
  author = {Limberger, Daniel and Trapp, Matthias and D{\"o}llner, J{\"u}rgen},
  title = {Depicting Uncertainty in 2.5D Treemaps},
  booktitle = {Proceedings of the 13th International Symposium on Visual Information Communication and Interaction},
  year = {2020},
  series = {VINCI~'20},
  publisher = {ACM},
  articleno = {28:1--2},
  doi = {10.1145/3430036.3432753},
  isbn = {978-1-450387-50-7},
}
Physically-based Environment and Area Lighting using Progressive Rendering in WebGL
Proc. ACM Int. Conf. on Web3D Technology (Web3D), 2020Philipp Otto, Daniel Limberger, and Jürgen Döllner
Abstract | BibTeX | DOI | Paper
This paper presents a progressive rendering approach that enables rendering of static 3D scenes, lit by physically-based environment and area lights. Multi-frame sampling strategies are used to approximate elaborate lighting that is refined while showing intermediate results to the user. The presented approach enables interactive yet high-quality rendering in the web and runs on a wide range of devices including low-performance hardware such as mobile devices. An open-source implementation of the described techniques using TypeScript and WebGL 2.0 is presented and provided. For evaluation, we compare our rendering results to both a path tracer and a physically-based rasterizer. Our findings show that the approach approximates the lighting and shadowing of the path-traced reference well while being faster than the compared rasterizer.
@inproceedings{otto2020-pbr-lighting,
  author = {Otto, Philipp and Limberger, Daniel and D{\"o}llner, J{\"u}rgen},
  title = {Physically-based Environment and Area Lighting using Progressive Rendering in WebGL},
  booktitle = {Proceedings of the 25th International Conference on 3D Web Technology},
  year = {2020},
  series = {Web3D~'20},
  publisher = {ACM},
  pages = {15:1--9},
  doi = {10.1145/3424616.3424697},
  isbn = {978-1-450381-69-7},
}
A Framework for Interactive Exploration of Clusters in Massive Data using 3D Scatter Plots and WebGL
Proc. ACM Int. Conf. on Web3D Technology (Web3D), 2020Lukas Wagner, Willy Scheibel, Daniel Limberger, Matthias Trapp, and Jürgen Döllner
Abstract | BibTeX | DOI | Paper
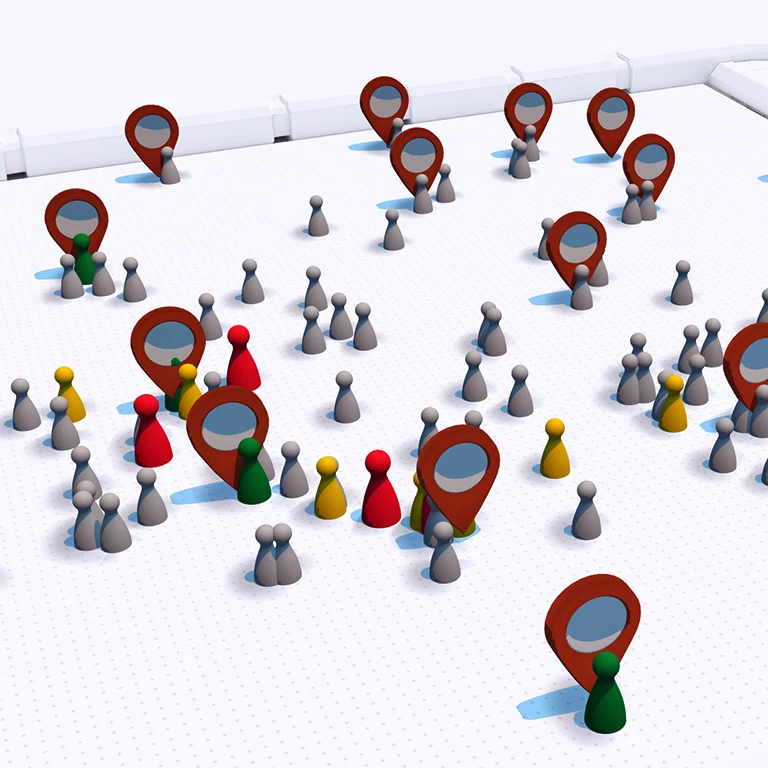
This paper presents a rendering framework for the visualization of massive point datasets in the web. It includes highly interactive point rendering, cluster visualization, basic interaction methods, and importance-based labeling, while being available for both mobile and desktop browsers. The rendering style is customizable, as shown in figure 1. Our evaluation indicates that the framework facilitates interactive visualization of tens of millions of raw data points even without dynamic filtering or aggregation.
@inproceedings{wagner2020-scatter-plot,
  author = {Wagner, Lukas and Limberger, Daniel and Scheibel, Willy and Trapp, Matthias and D{\"o}llner, J{\"u}rgen},
  title = {A Framework for Interactive Exploration of Clusters in Massive Data using 3D Scatter Plots and WebGL},
  booktitle = {Proceedings of the 25th International Conference on 3D Web Technology},
  year = {2020},
  series = {Web3D~'20},
  publisher = {ACM},
  pages = {31:1--2},
  doi = {10.1145/3424616.3424730},
  isbn = {978-1-450381-69-7},
}
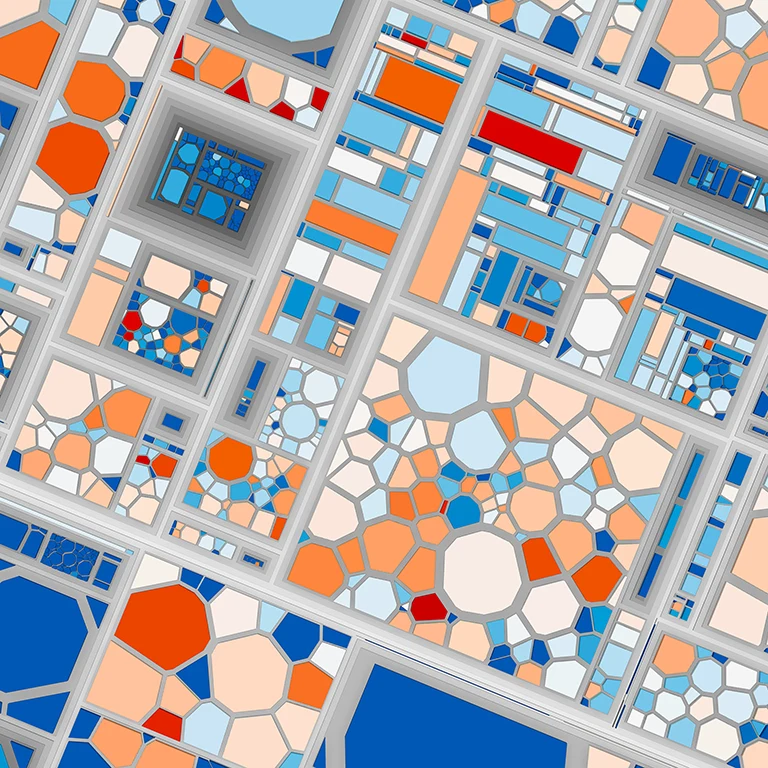
A Taxonomy of Treemap Visualization Techniques
Proc. Int. Conf. on Information Visualization Theory and Applications (IVAPP), 2020Willy Scheibel, Matthias Trapp, Daniel Limberger, and Jürgen Döllner
Abstract | BibTeX | DOI | Paper | Slides
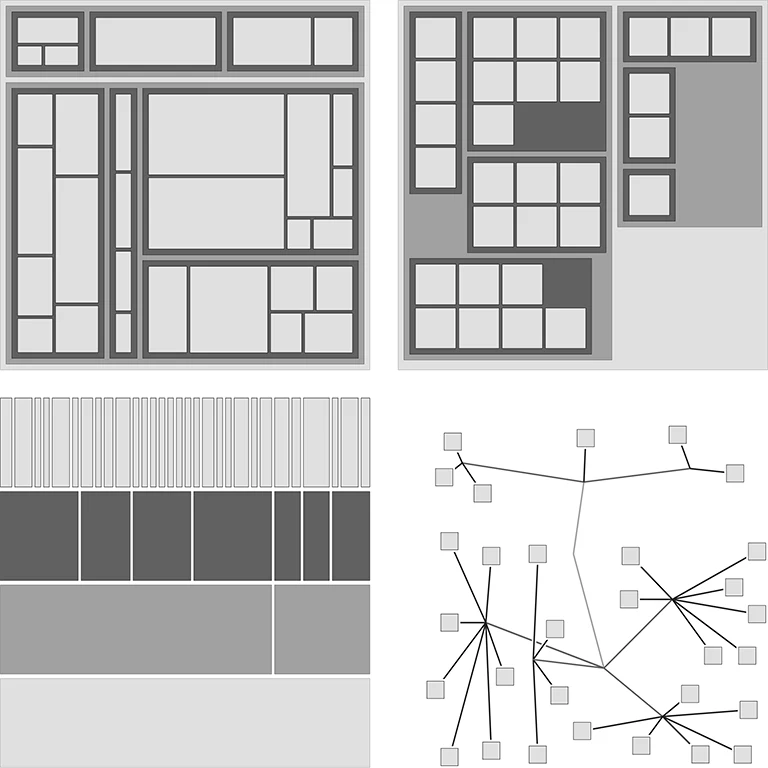
A treemap is a visualization that has been specifically designed to facilitate the exploration of tree-structured data and, more general, hierarchically structured data. The family of visualization techniques that use a visual metaphor for parent-child relationships based "on the property of containment" (Johnson, 1993) is commonly referred to as treemaps. However, as the number of variations of treemaps grows, it becomes increasingly important to distinguish clearly between techniques and their specific characteristics. This paper proposes to discern between Space-filling Treemap, Containment Treemap, Implicit Edge Representation Tree, and Mapped Tree for classification of hierarchy visualization techniques and highlights their respective properties. This taxonomy is created as a hyponymy, i.e., its classes have an is-a relationship to one another. With this proposal, we intend to stimulate a discussion on a more unambiguous classification of treemaps and, furthermore, broaden what is understood by the concept of treemap itself.
@inproceedings{scheibel2020-taxonomy,
  author = {Scheibel, Willy and Trapp, Matthias and Limberger, Daniel and J{\"u}rgen D{\"o}llner},
  title = {A Taxonomy of Treemap Visualization Techniques},
  booktitle = {Proceedings of the 15th International Joint Conference on Computer Vision, Imaging and Computer Graphics Theory and Applications},
  year = {2020},
  series = {VISIGRAPP~'20},
  publisher = {SciTePress},
  pages = {273--280},
  doi = {10.5220/0009153902730280},
  isbn = {978-9-897584-02-2},
}
Visualization of Tree-structured Data using Web Service Composition
VISIGRAPP 2019: Computer Vision, Imaging and Computer Graphics Theory and Applications, 2020Willy Scheibel, Judith Hartmann, Daniel Limberger, and Jürgen Döllner
Abstract | BibTeX | DOI | Paper
This article reiterates on the recently presented hierarchy visualization service HiViSer and its API. It illustrates its decomposition into modular services for data processing and visualization of tree-structured data. The decomposition is aligned to the common structure of visualization pipelines and, in this way, facilitates attribution of the services' capabilities. Suitable base resource types are proposed and their structure and relations as well as a subtyping concept for specifics in hierarchy visualization implementations are detailed. Moreover, state-of-the-art quality standards and techniques for self-documentation and discovery of components are incorporated. As a result, a blueprint for Web service design, architecture, modularization, and composition is presented, targeting fundamental visualization tasks of tree-structured data, i.e., gathering, processing, rendering, and provisioning. Finally, the applicability of the service components and the API is evaluated in the context of exemplary applications.
@inproceedings{scheibel2019-hiviser-extended,
  author = {Scheibel, Willy and Hartmann, Judith and Limberger, Daniel and D{\"o}llner, J{\"u}rgen},
  title = {Visualization of Tree-structured Data using Web Service Composition},
  booktitle = {Computer Vision, Imaging and Computer Graphics Theory and Applications},
  year = {2019},
  publisher = {Springer},
  pages = {227--252},
  doi = {10.1007/978-3-030-41590-7_10},
  isbn = {978-3-030415-90-7},
}
Advanced Visual Metaphors and Techniques for Software Maps
Proc. ACM Int. Symp. on Visual Information Communication and Interaction (VINCI), 2019Daniel Limberger, Willy Scheibel, Matthias Trapp, and Jürgen Döllner
Abstract | BibTeX | DOI | Paper
Software maps provide a general-purpose interactive user interface and information display for software analytics tools. This paper systematically introduces and classifies software maps as a treemap-based technique for software cartography. It provides an overview of advanced visual metaphors and techniques, each suitable for interactive visual analytics tasks, that can be used to enhance the expressiveness of software maps. Thereto, the metaphors and techniques are briefly described, located within a visualization pipeline model, and considered within the software map design space. Consequent applications and use cases w.r.t. different types of software system data and software engineering data are discussed, arguing for a versatile use of software maps in visual software analytics.
@inproceedings{limberger2019-advanced,
  author = {Limberger, Daniel and Scheibel, Willy and Trapp, Matthias and D{\"o}llner, J{\"u}rgen},
  title = {Advanced Visual Metaphors and Techniques for Software Maps},
  booktitle = {Proceedings of the 12th International Symposium on Visual Information Communication and Interaction},
  year = {2019},
  series = {VINCI~'19},
  publisher = {ACM},
  pages = {11:1--8},
  doi = {10.1145/3356422.3356444},
  isbn = {978-1-450376-26-6},
}
In-Situ Comparison for 2.5D Treemaps
Proc. Int. Conf. on Information Visualization Theory and Applications (IVAPP), 2019Daniel Limberger, Matthias Trapp, and Jürgen Döllner
Abstract | BibTeX | DOI | Paper | Poster | Template Card
2.5D treemaps can be used to visualize tree-structured data using the height dimension for additional information display. For tree-structured and time-variant data though, changes or variants in the data are difficult to visualize. This paper presents an in-situ approach to depict differences between two versions (original and comparative state) of a data set, e.g., metrics of different revisions of a software system, in a single 2.5D treemap. Multiple geometry variants for the in-situ representation of individual nodes, especially concerning height, area, and color, are presented and discussed. Finally, a preliminary study for the simultaneous change of attributes in height and area is described, hinting that arrow pattern help to clarify reading direction.
@inproceedings{limberger2019-insitu,
  author = {Limberger, Daniel and Trapp, Matthias and D{\"ö}llner, J{\"ü}rgen},
  title = {In-Situ Comparison for 2.5D Treemaps},
  booktitle = {Proceedings of the 14th International Joint Conference on Computer Vision, Imaging and Computer Graphics Theory and Applications},
  year = {2019},
  series = {IVAPP~'19},
  publisher = {SciTePress},
  pages = {314--321},
  doi = {10.5220/0007576203140321},
  isbn = {978-9-897583-54-4},
}
Interactive, Height-based Filtering in 2.5D Treemaps
Proc. ACM Int. Symp. on Visual Information Communication and Interaction (VINCI), 2018Daniel Limberger, Matthias Trapp, and Jürgen Döllner
Abstract | BibTeX | DOI | Paper | Slides
The 2.5D treemap facilitates interactive exploration of multivariate data. It includes height as a visual variable for additional information display and enables exploration of correlations within mapped attributes. In this paper techniques for the visual display of a height reference for interactive modification from within the visualization are introduced. Results of a preliminary user study are presented and potential benefits for improved performance, i.e., precision and speed, of identification, comparison, filtering, and selection tasks are discussed.
@inproceedings{limberger2018-reference,
  author = {Limberger, Daniel and Trapp, Matthias and D{\"o}llner, J{\"u}rgen},
  title = {Interactive, Height-Based Filtering in 2.5D Treemaps},
  booktitle = {Proceedings of the 11th International Symposium on Visual Information Communication and Interaction},
  year = {2018},
  series = {VINCI~'18},
  publisher = {ACM},
  pages = {49--55},
  doi = {10.1145/3231622.3231638},
  isbn = {978-1-450365-01-7},
}
Progressive Rendering using Multi-frame Sampling | Reprint of the GPU Pro 7 Article
GPU Pro 360 Guide to Rendering, 2018Daniel Limberger, Karsten Tausche, Johannes Linke, and Jürgen Döllner
This chapter presents an approach that distributes sampling over multiple, consecutive frames, and, thereby, enables sampling-based, real-time rendering techniques to be implemented for most graphics hardware and systems in a less complex, straightforward way. This systematic, extensible schema allows developers to effectively handle the increasing implementation complexity of advanced, sophisticated, real-time rendering techniques, while improving responsiveness and reducing required hardware resources.
@article{limberger2018-multi-frame-pro,
  title = {Progressive Rendering using Multi-frame Sampling},
  author = {Limberger, Daniel and Tausche, Karsten and Linke, Johannes and D{\"o}llner, J{\"u}rgen},
  journal = {GPU Pro 360 Guide to Rendering},
  year = {2018},
  publisher = {A. K. Peters, Ltd.},
  pages = {537--553},
  doi = {10.1201/9781351261524},
  isbn = {978-1-351261-52-4},
  note = {Reprint of the GPU Pro 7 Article, 2016},
}
Interactive, Adaptive Level-of-Detail in 2.5D Treemaps
United States Patent and Trademark Office, 2018Daniel Limberger
Abstract | BibTeX | Patent | USPTO
An aggregation approach allows for a dynamic, interactive, adaptive level-of-detail for 2D, 2.5D, and 3D treemaps for visualization of complex information. For example, the 2.5D treemap visualization concept is extended by providing adaptive identification of aggregates by means of an interactive node scoring approach based on contextual relevance and various other task, interaction, visibility, and/or performance specific criteria. For the resulting mapping and rendering, a per-frame aggregation of blocks and accumulation of those attributes mapped to visual variables (context) is described. Since every embodiment is also targeted for dynamic, interactive visual display of 2.5D treemaps, the rendering is designed to be capable for execution in real-time. Visual preservation of important information is conveyed by hierarchy elements and their mapped attributes (nodes-of-interest) as well as compliance to known aggregation guidelines including visualization of aggregated color and height information, visualization of aggregates that are discernible from non-aggregates, and visualization of outliers within aggregates. Applications include visualization of software maps, business intelligence data, file hierarchies for storage devices, and the like.
@patent{limberger2018-lod-patent,
  title = {Interactive, Adaptive Level-of-Detail in 2.5 D Treemaps},
  author = {Limberger, Daniel},
  year = {2018},
  date = {2018-04-24},
  number = {9953443},
  holder = {Seerene GmbH},
  type = {patentus},
}
OpenLL: an API for Dynamic 2D and 3D Labeling
Proc. IEEE Int. Conf. Information Visualisation (iV), 2018Daniel Limberger, Anne Gropler, Stefan Buschmann, Jürgen Döllner, and Benjamin Wasty
Abstract | BibTeX | DOI | Paper | Slides
Today's rendering APIs lack robust functionality and capabilities for dynamic, real-time text rendering and labeling, which represent key requirements for 3D application design in many fields. As a consequence, most rendering systems are barely or not at all equipped with respective capabilities. This paper drafts the unified text rendering and labeling API OpenLL intended to complement common rendering APIs, frameworks, and transmission formats. For it, various uses of static and dynamic placement of labels are showcased and a text interaction technique is presented. Furthermore, API design constraints with respect to state-of-the-art text rendering techniques are discussed. This contribution is intended to initiate a community-driven specification of a free and open label library.
@inproceedings{limberger2018-openll,
  author = {Limberger, Daniel and Gropler, Anne and Buschmann, Stefan and Wasty, Benjamin and D{\"o}llner, J{\"u}rgen},
  booktitle = {22nd International Conference Information Visualisation},
  title = {OpenLL: An API for Dynamic 2D and 3D Labeling},
  year = {2018},
  series = {IV~'18},
  publisher = {IEEE},
  pages = {175--181},
  doi = {10.1109/iV.2018.00039},
  isbn = {978-1-538672-02-0},
}
Mixed-Projection Treemaps: A Novel Approach Mixing 2D and 2.5D Treemaps
Proc. IEEE Int. Conf. Information Visualisation (iV), 2017Daniel Limberger, Willy Scheibel, Matthias Trapp, and Jürgen Döllner
Abstract | BibTeX | DOI | Paper | Slides
This paper presents a novel technique for combining 2D and 2.5D treemaps using multi-perspective views to leverage the advantages of both treemap types. It enables a new form of overview+detail visualization for tree-structured data and contributes new concepts for real-time rendering of and interaction with treemaps. The technique operates by tilting the graphical elements representing inner nodes using affine transformations and animated state transitions. We explain how to mix orthogonal and perspective projections within a single treemap. Finally, we show application examples that benefit from the reduced interaction overhead.
@inproceedings{limberger2017-mixed,
  author = {Limberger, Daniel and Scheibel, Willy and Trapp, Matthias and D{\"o}llner, J{\"u}rgen},
  title = {Mixed-Projection Treemaps: A Novel Approach Mixing 2D and 2.5D Treemaps},
  booktitle = {21st International Conference Information Visualisation},
  year = {2017},
  series = {IV~'17},
  publisher = {IEEE},
  pages = {164--169},
  doi = {10.1109/iV.2017.67},
  isbn = {978-1-538608-31-9},
}
Progressive High-Quality Rendering for Interactive Information Cartography using WebGL
Proc. ACM Int. Conf. on 3D Web Technology (Web3D), 2017, Best PaperDaniel Limberger, Marcel Pursche, Jan Klimke, and Jürgen Döllner
Abstract | BibTeX | DOI | Paper
Information cartography services provided via web-based clients using real-time rendering do not always necessitate a continuous stream of updates in the visual display. This paper shows how progressive rendering by means of multi-frame sampling and frame accumulation can introduce high-quality visual effects using robust and straightforward implementations. For it, (1) a suitable rendering loop is described, (2) WebGL limitations are discussed, and (3) an adaption of THREE.js featuring progressive anti-aliasing, screen-space ambient occlusion, and depth of field is detailed. Furthermore, sampling strategies are discussed and rendering performance is evaluated, emphasizing the low per-frame costs of this approach.
@inproceedings{limberger2017-progressive,
  author = {Limberger, Daniel and Pursche, Marcel and Klimke, Jan and D{\"o}llner, J{\"u}rgen},
  title = {Progressive High-quality Rendering for Interactive Information Cartography using WebGL},
  booktitle = {Proceedings of the 22nd International Conference on 3D Web Technology},
  year = {2017},
  series = {Web3D~'17},
  publisher = {ACM},
  pages = {8:1--4},
  doi = {10.1145/3055624.3075951},
  isbn = {978-1-450349-55-0},
}
Reducing Visual Complexity in Software Maps using Importance-based Aggregation of Nodes
Proc. Int. Conf. on Information Visualization Theory and Applications (IVAPP), 2017Daniel Limberger, Willy Scheibel, Sebastian Hahn, and Jürgen Döllner
Abstract | BibTeX | DOI | Paper | Slides
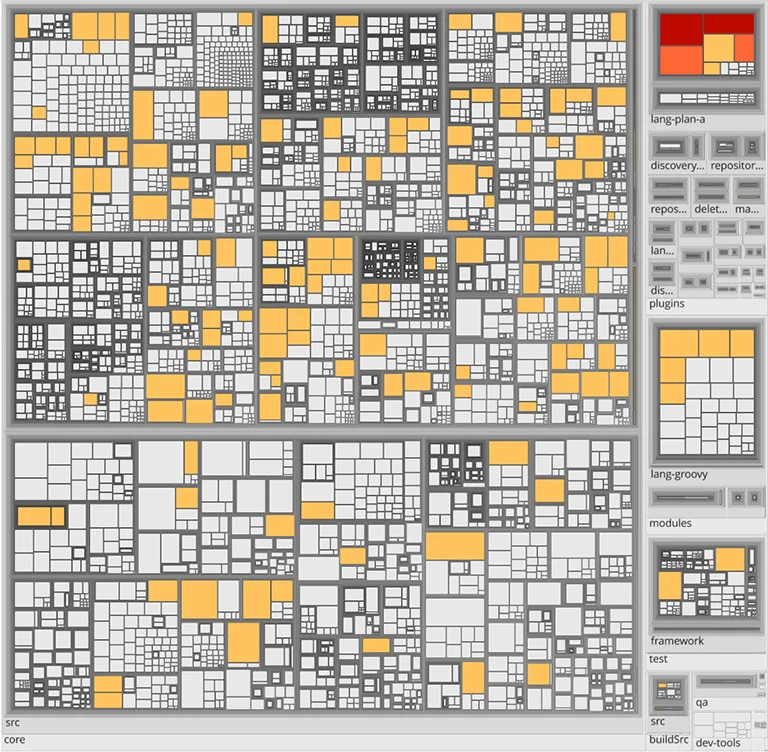
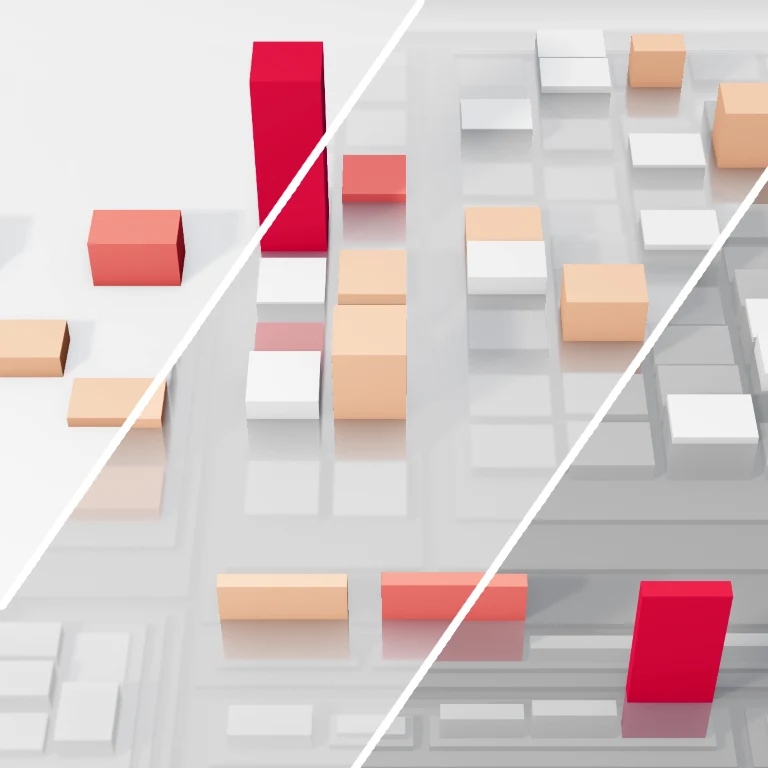
Depicting massive software system data using treemaps can result in visual clutter and increased cognitive load. This paper introduces an adaptive level-of-detail (LoD) technique that uses scoring for interactive aggregation on a per-node basis. The scoring approximates importance by degree-of-interest measures as well as screen and user-interaction scores. The technique adheres to established aggregation guidelines and was evaluated by means of two user studies. The first investigates task completion time in visual search. The second evaluates the readability of the presented nesting level contouring for aggregates. With the adaptive LoD technique software maps allow for multi-resolution depictions of software system information while facilitating annotation and efficient identification of important nodes.
@inproceedings{limberger2017-aggregation,
  author = {Limberger, Daniel and Scheibel, Willy and Hahn, Sebastian and D{\"o}llner, J{\"u}rgen},
  title = {Reducing Visual Complexity in Software Maps using Importance-based Aggregation of Nodes},
  booktitle = {Proceedings of the 12th International Joint Conference on Computer Vision, Imaging and Computer Graphics Theory and Applications},
  year = {2017},
  series = {IVAPP~'17},
  publisher = {SciTePress},
  pages = {176--185},
  doi = {10.5220/0006267501760185},
  isbn = {978-9-897582-28-8},
}

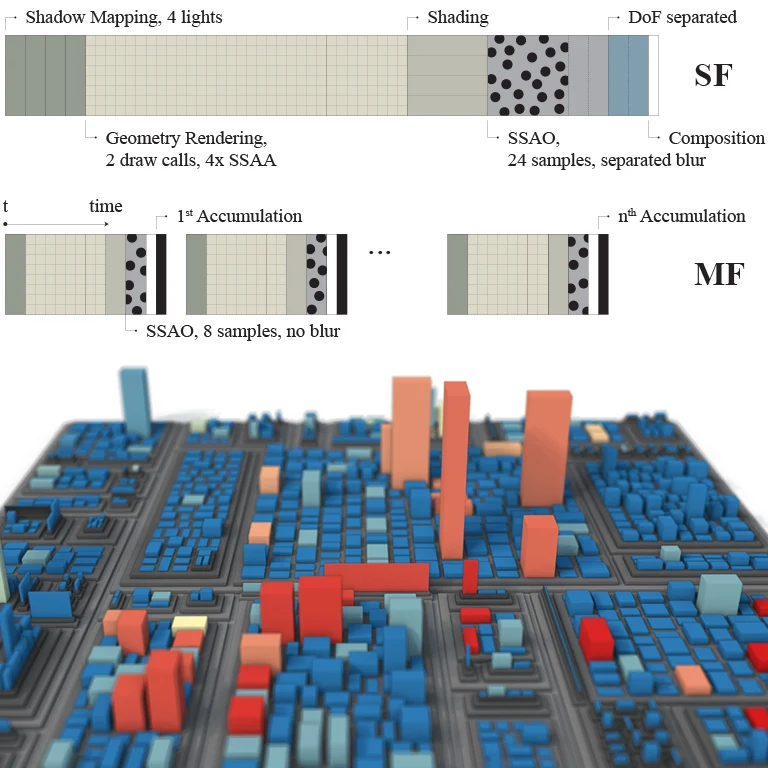
Real-time Rendering of High-quality Effects using Multi-frame Sampling
ACM SIGGRAPH Posters, 2016Daniel Limberger and Jürgen Döllner
Abstract | BibTeX | DOI | Poster | Source Code | Demo
In a rendering environment of comparatively sparse interaction, e.g., digital production tools, image synthesis and its quality do not have to be constrained to single frames. This work analyzes strategies for highly economically rendering of state-of-the-art rendering effects using progressive multi-frame sampling in real-time. By distributing and accumulating samples of sampling-based rendering techniques (e.g., anti-aliasing, orderindependent transparency, depth-of-field and shadowing, ambient occlusion, screen-space reflections) over multiple frames, images of very high quality can be synthesized with unequaled resource-efficiency.
@inproceedings{limberger2016-multi-frame-sampling,
  author = {Limberger, Daniel and D{\"o}llner, J{\"u}rgen},
  title = {Real-time Rendering of High-quality Effects using Multi-frame Sampling},
  booktitle = {ACM SIGGRAPH 2016 Posters},
  year = {2016},
  series = {SIGGRAPH~'16},
  pages = {79:1--1},
  publisher = {ACM},
  doi = {10.1145/2945078.2945157},
  isbn = {978-1-4503-4371-8},
}
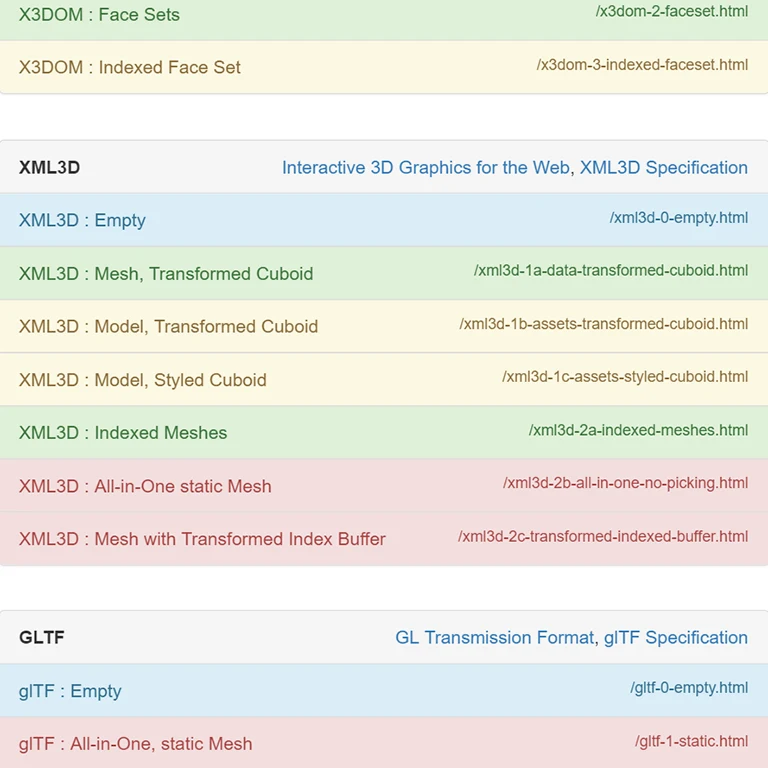
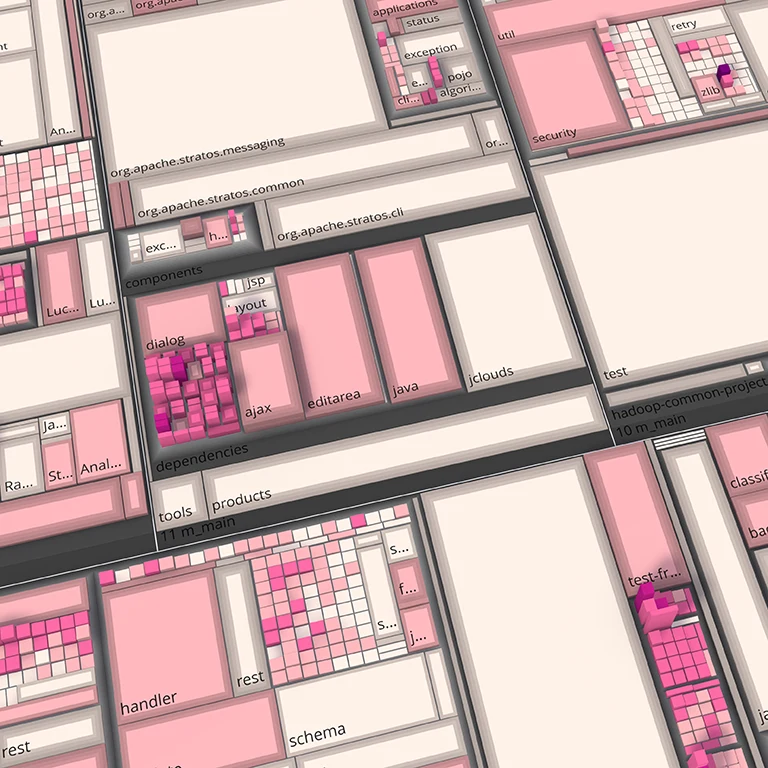
Dynamic 2.5D Treemaps using Declarative 3D on the Web
Proc. ACM Int. Conf. on Web3D Technology (Web3D), 2016Daniel Limberger, Willy Scheibel, Stefan Lemme, and Jürgen Döllner
Abstract | BibTeX | DOI | Paper | Slides | Source Code | Demo
The 2.5D treemap represents a general purpose visualization technique to map multi-variate hierarchical data in a scalable, interactive, and consistent way used in a number of application fields. In this paper, we explore the capabilities of Declarative 3D for the web-based implementation of 2.5D treemap clients. Particularly, we investigate how X3DOM and XML3D can be used to implement clients with equivalent features that interactively display 2.5D treemaps with dynamic mapping of attributes. We also show a first step towards a glTF-based implementation. These approaches are benchmarked focusing on their interaction capabilities with respect to rendering and speed of dynamic data mapping. We discuss the results for our representative example of a complex 3D interactive visualization technique and summerize recommendations for improvements towards operational web clients.
@inproceedings{limberger2016-declarative-treemaps,
  author = {Limberger, Daniel and Scheibel, Willy and Lemme, Stefan and D{\"o}llner, J{\"u}rgen},
  title = {Dynamic 2.5D Treemaps using Declarative 3D on the Web},
  booktitle = {Proceedings of the 21st International Conference on Web3D Technology},
  year = {2016},
  series = {Web3D~'16},
  publisher = {ACM},
  pages = {33--36},
  doi = {10.1145/2945292.2945313},
  isbn = {978-1-450344-28-9},
}
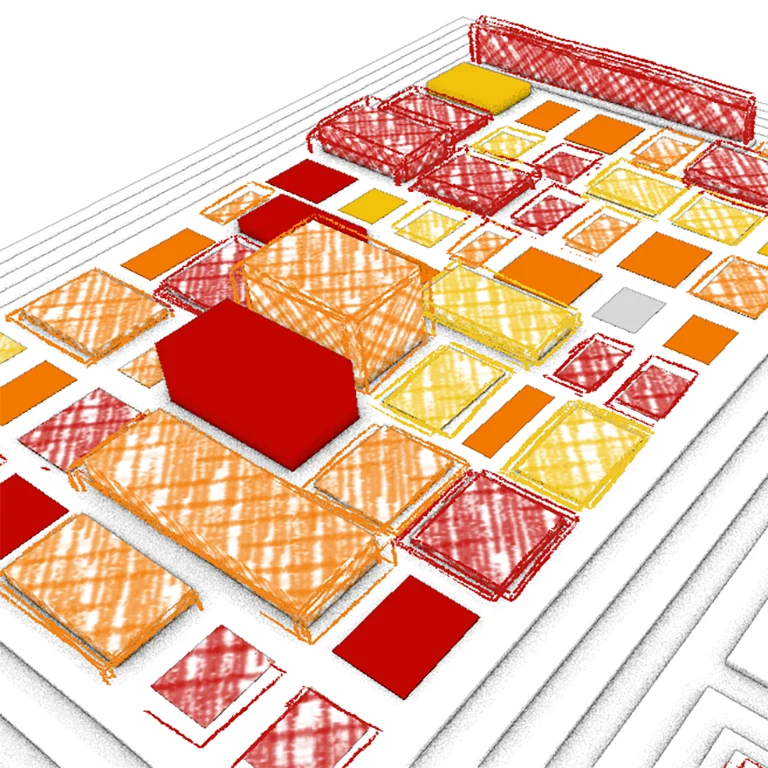
Evaluation of Sketchiness as a Visual Variable for 2.5D Treemaps
Proc. IEEE Int. Conf. Information Visualisation (iV), 2016Daniel Limberger, Carolin Fiedler, Sebastian Hahn, Matthias Trapp, and Jürgen Döllner
Abstract | BibTeX | DOI | Paper
Treemaps serve as generic, effective tools to display, explore, and analyze multi-variate tree data in a scalable, interactive, and consistent way In this paper, we discuss and evaluate sketchiness as visual variable of 2.5D treemaps. Sketchy rendering techniques allow us to map data, e.g., about uncertainty, imprecision, or vagueness, independently from mappings to other visual variables such as size, color, and height. To this end, we present a design space for sketchy rendering for 2.5D treemaps and corresponding implementation of a real-time sketchy rendering technique. The results of three user studies carried out indicate that sketchiness is a promising candidate for an independent visual variable for 2.5D treemaps, in particular to map ordinal data with a small range such as data that qualifies map items, it shows no strong interference with other visual variables such as color and height due to the regular gestalt of blocks and, hence, allows us to extend the expressiveness of 2.5D treemaps.
@inproceedings{limberger2016-sketchiness-treemaps,
  author = {Limberger, Daniel and Fiedler, Carolin and Hahn, Sebastian and Trapp, Matthias and D{\"o}llner, J{\"u}rgen},
  title = {Evaluation of Sketchiness as a Visual Variable for 2.5D Treemaps},
  booktitle = {20th International Conference Information Visualisation},
  year = {2016},
  series = {IV~'16},
  publisher = {IEEE},
  pages = {183--189},
  doi = {10.1109/IV.2016.61},
  isbn = {978-1-467389-42-6},
}
Progressive Rendering using Multi-frame Sampling
GPU Pro 7: Advanced Rendering Techniques, 2016Daniel Limberger, Karsten Tausche, Johannes Linke, and Jürgen Döllner
This chapter presents an approach that distributes sampling over multiple, consecutive frames, and, thereby, enables sampling-based, real-time rendering techniques to be implemented for most graphics hardware and systems in a less complex, straightforward way. This systematic, extensible schema allows developers to effectively handle the increasing implementation complexity of advanced, sophisticated, real-time rendering techniques, while improving responsiveness and reducing required hardware resources.
@article{limberger2016-multi-frame-sampling-pro,
  author = {Limberger, Daniel and Tausche, Karsten and Linke, Johannes and D{\"o}llner, J{\"u}rgen},
  title = {Progressive Rendering using Multi-frame Sampling},
  journal = {GPU Pro 7: Advanced Rendering Techniques},
  year = {2016},
  publisher = {CRC Press},
  pages = {155--173},
  doi = {10.1201/b21261},
  isbn = {978-0-429160-03-5},
}
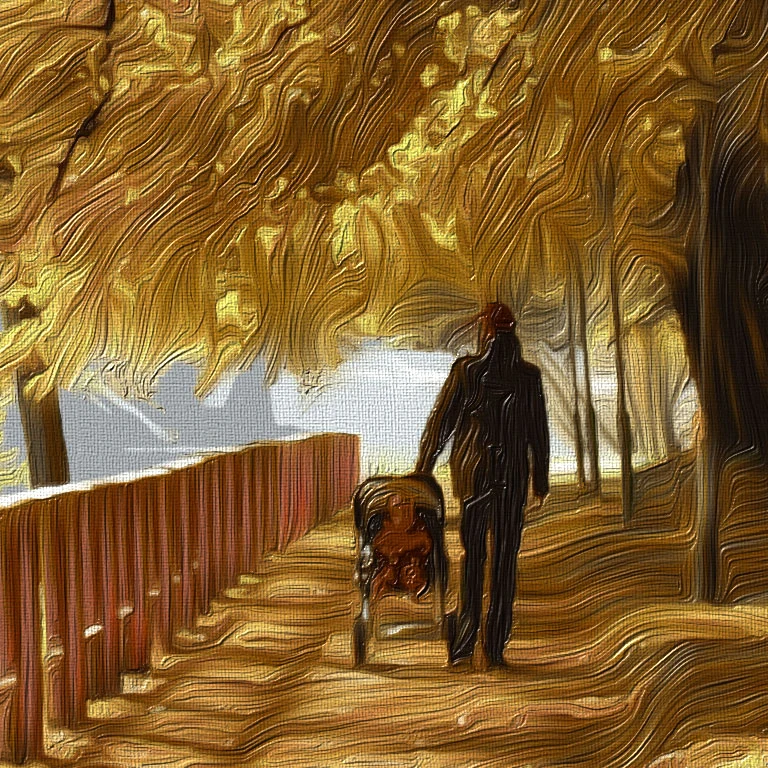
Image Stylization by Interactive Oil Paint Filtering
Computers & Graphics, 2016, CGF Cover Contest 2016 (Runner-up)Amir Semmo, Daniel Limberger, Jan Eric Kyprianidis, and Jürgen Döllner
Abstract | BibTeX | DOI | Paper
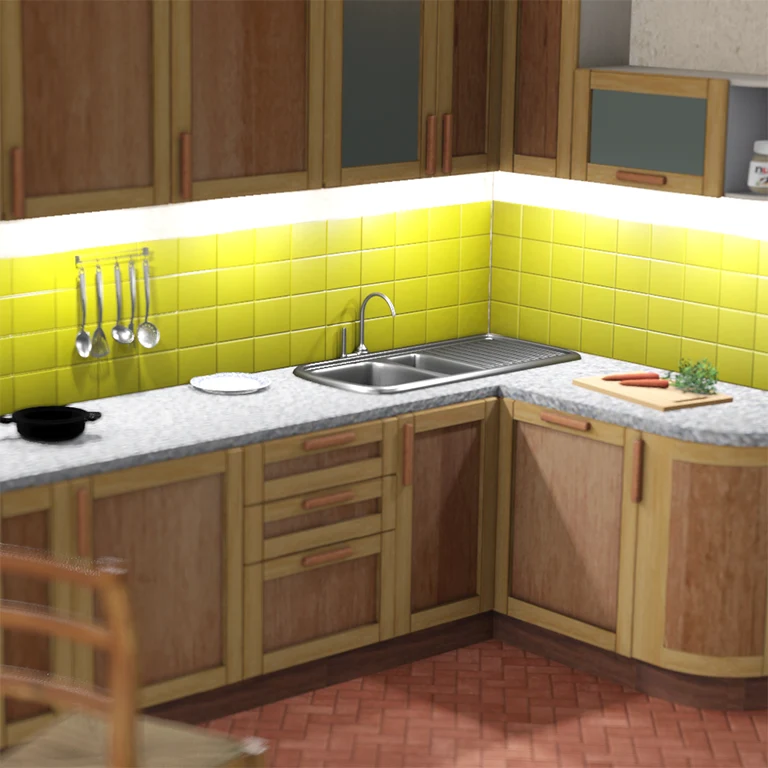
An interactive system for transforming images into an oil paint look is presented. First, dominant colors from an input image are derived for feature-aware recolorization and quantization to conform with a global color palette. Afterwards, it employs non-linear filtering based on the smoothed structure adapted to the main feature contours of the quantized image to synthesize a paint texture in real-time. Furthermore, a generalized brush-based painting interface is introduced that operates within parameter spaces to locally adjust the level of abstraction of the filtering effects.
@article{semmo2016-oilpaint-stylization,
  author = {Semmo, Amir and Limberger, Daniel and Kyprianidis, Jan Eric and D{\"o}llner, J{\"u}rgen},
  title = {Image Stylization by Interactive Oil Paint Filtering},
  journal = {Computers \& Graphics},
  year = {2016},
  volume = {55},
  pages = {157--171},
  doi = {10.1016/j.cag.2015.12.001}
}
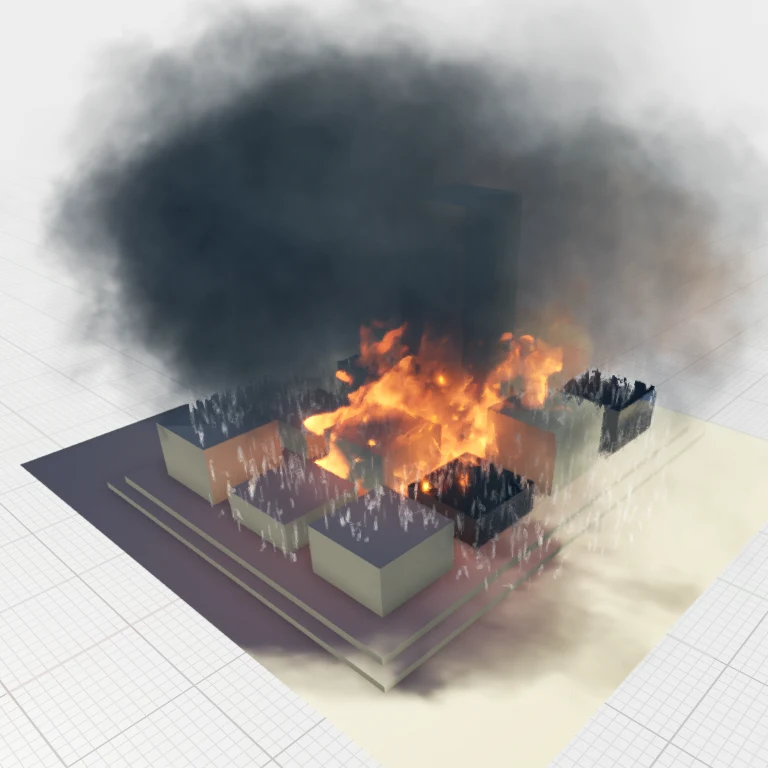
Natural Phenomena as Metaphors for Visualization of Trend Data in Interactive Software Maps
Proc. EG Computer Graphics and Visual Computing (CGVC), 2015Hannes Würfel, Matthias Trapp, Daniel Limberger, and Jürgen Döllner
Abstract | BibTeX | DOI | Paper
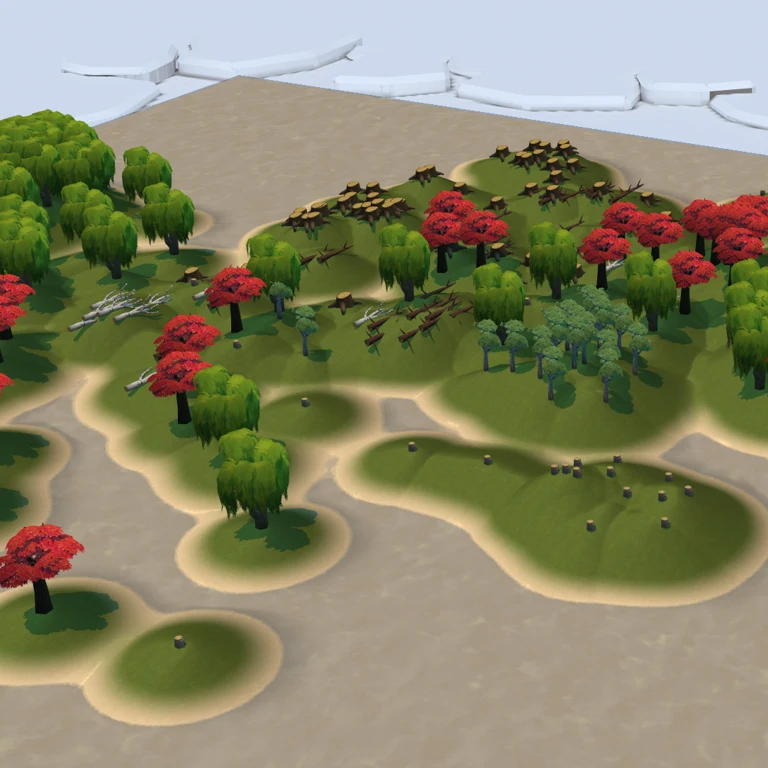
This work explores the suitability of rendering natural phenomena in Software maps for effective communication of changes as well as trends. Therefore, Unreal Engine 4 is prototypically used to render Software maps and natural phenomena, such as fire, clouds, smoke, rain, rust, or shininess in real-time. Trend data is automatically computed by hierarchically accumulating as well as analyzing the underlying software metrics, and is mapped to the additional visual variables.
@inproceedings{wuerfel2015-natural-metaphors,
  author = {W{\"u}rfel, Hannes and Trapp, Matthias and Limberger, Daniel and D{\"o}llner, J{\"u}rgen},
  title = {Natural Phenomena as Metaphors for Visualization of Trend Data in Interactive Software Maps},
  booktitle = {Computer Graphics and Visual Computing (CGVC)},
  year = {2015},
  series= {CGVC~'15},
  publisher = {The Eurographics Association},
  pages = {69--76},
  doi = {10.2312/cgvc.20151246},
  isbn = {978-3-905674-94-1},
}
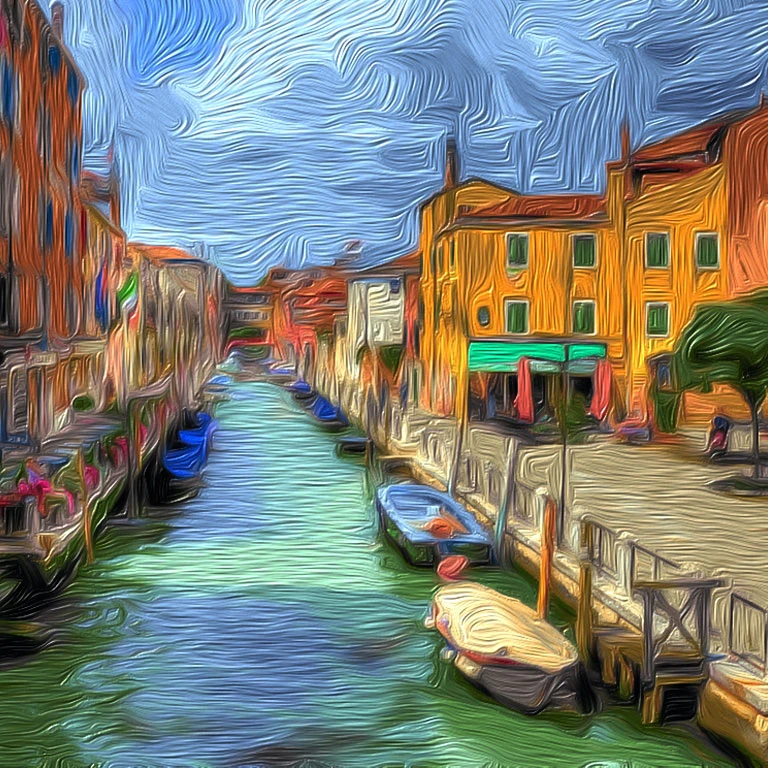
Image Stylization by Oil Paint Filtering using Color Palettes
Proc. EG Computational Aesthetics (CAe), 2015, Best PaperAmir Semmo, Daniel Limberger, Jan Eric Kyprianidis, and Jürgen Döllner
Abstract | BibTeX | DOI | Paper | Video
This paper presents an approach for transforming images into an oil paint look. A color quantization scheme is proposed that performs feature-aware recolorization using the dominant colors of the input image. In addition, an approach for real-time computation of paint textures is presented that builds on the smoothed structure adapted to the main feature contours of the quantized image. The stylization technique leads to homogeneous outputs in the color domain and enables creative control over the visual output, such as color adjustments and per-pixel parametrizations by means of interactive painting.
@inproceedings{semmo2015-oilpaint-stylization,
  author = {Semmo, Amir and Limberger, Daniel and Kyprianidis, Jan Eric and D{\"o}llner, J{\"u}rgen},
  title = {Image Stylization by Oil Paint Filtering using Color Palettes},
  booktitle = {Proceedings of the Workshop on Computational Aesthetics},
  year = {2015},
  series = {CAE~'15},
  publisher = {Eurographics Association},
  pages = {149--158},
  doi = {10.2312/exp.20151188},
}
Painting Per-Pixel Parametrization for Interactive Image Filtering
ACM/EG Expressive Posters, 2014Daniel Limberger and Jürgen Döllner
This work presents a photo-editing method that enables per-pixel parameter manipulation of image filtering by means of interactive painting. Predefined or custom image filters are exposed to the user, as a parametrizable composition of image operations. Brushes, as sequences of actions mapping user inputs (in terms of brush shape, flow, pressure, etc.) to arbitrary functions or convolution operators, are used to draw within the parameter space. It demonstrates how interactive painting can be used to, e.g., locally tweak parametrization and, furthermore, provides a blueprint for an collaborative photo-editing platform.
@misc{limberger2014-parameter-painting,
  author = {Limberger, Daniel and D{\"o}llner, J{\"u}rgen},
  title = {Painting Per-Pixel Parametrization for Interactive Image Filtering},
  year = {2014},
  note = {Poster presented at the Expressive 2014 Poster Session, August 8, Fletcher Challenge Theatre, Harbour Centre},
}
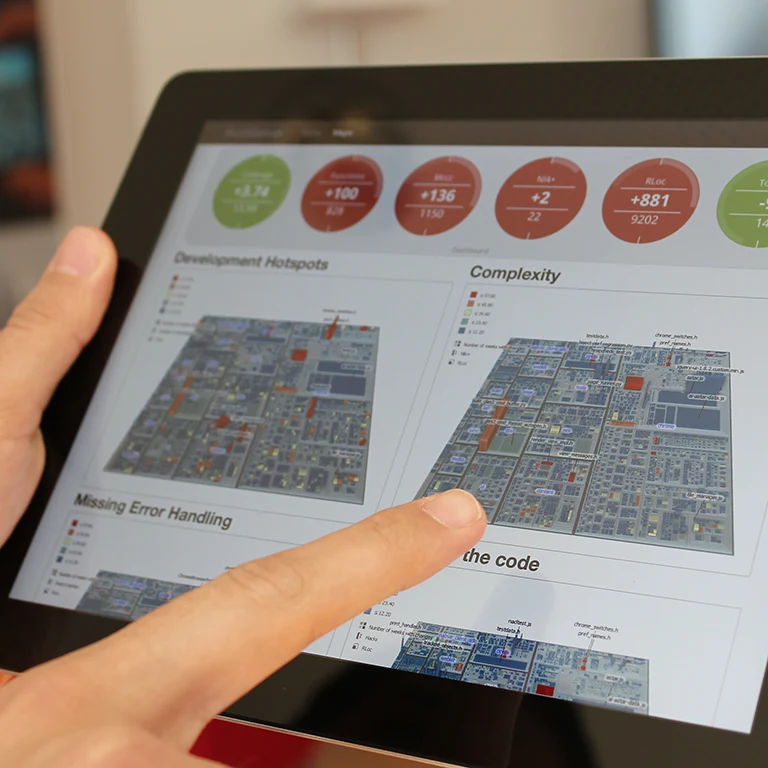
Interactive Software Maps for Web-Based Source Code Analysis
Proc. ACM Int. Conf. on Web3D Technology (Web3D), 2013Daniel Limberger, Benjamin Wasty, Jonas Trümper, and Jürgen Döllner
Abstract | BibTeX | DOI | Paper | Slides | Video
Software maps—linking 2.5D treemaps, software system structure, and performance indicators—are commonly used to support informed decision making in software-engineering processes. In this paper a web-based rendering system for software maps that achieves both fast client-side page load time and interactive frame rates even with large software maps is presented. The page load time is significantly reduced by efficiently encoding hierarchy and geometry data for the net transport.
@inproceedings{limberger2013-interactive,
  author = {Limberger, Daniel and Wasty, Benjamin and Tr{\"u}mper, Jonas and D{\"o}llner, J{\"u}rgen},
  title = {Interactive Software Maps for Web-based Source Code Analysis},
  booktitle = {Proceedings of the 18th International Conference on 3D Web Technology},
  year = {2013},
  series = {Web3D~'13},
  publisher = {ACM},
  pages = {91--98},
  doi = {10.1145/2466533.2466550},
  isbn = {978-1-450321-33-4},
}
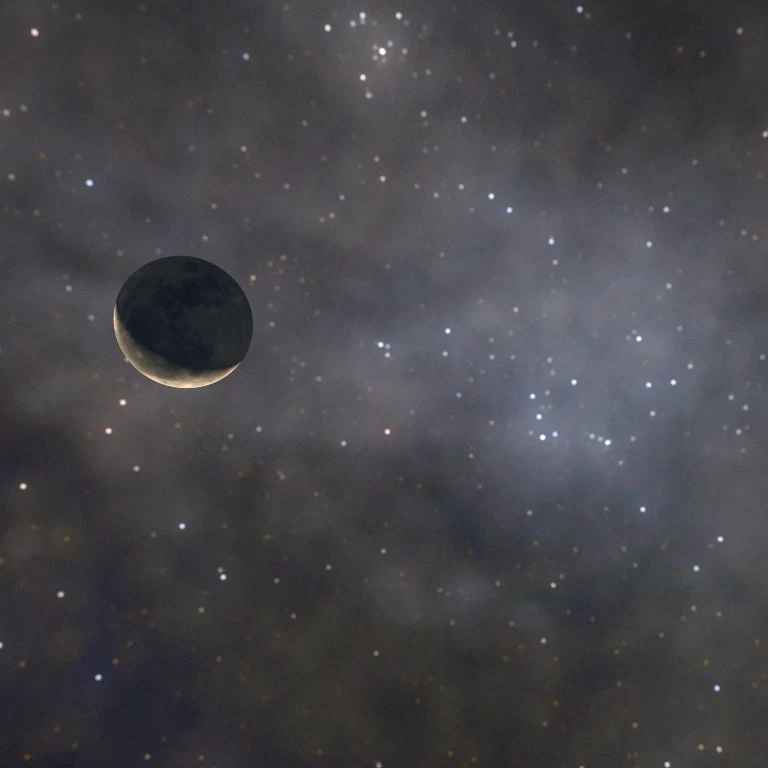
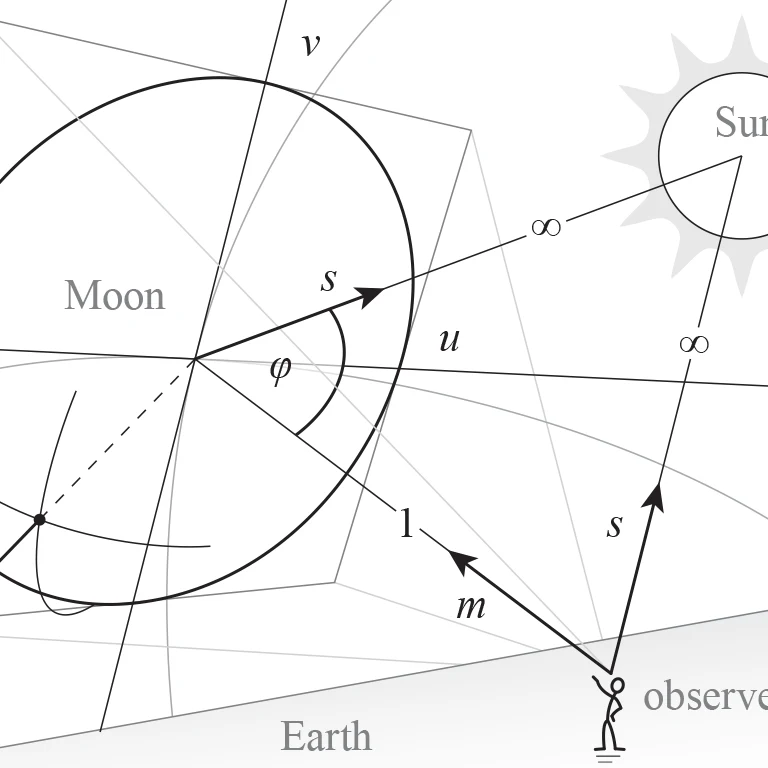
Single-Pass Rendering of Day and Night Sky Phenomena
Proc. EG Int. Workshop on Vision, Modeling, and Visualization (VMV), 2012Daniel Müller (now Limberger), Juri Engel, and Jürgen Döllner
Abstract | BibTeX | DOI | Paper | Slides | Video | Source Code
This paper presents techniques for astronomical based, real-time rendering of skies as seen from low altitudes on earth, in respect to location, date, and time. The techniques allow for composing an atmosphere with sun, multiple cloud layers, moon, bright stars, and Milky Way, into a holistic sky with unprecedented level of detail and diversity. GPU generated, viewpoint-aligned billboards are used to render stars with approximated color, brightness, and scintillations. A similar approach is used to synthesize the moon considering lunar phase, earthshine, shading, and lunar eclipses.
@inproceedings{limberger2012-sky-phenomena,
  author = {M{\"u}ller, Daniel and Engel, Juri and D{\"o}llner, J{\"u}rgen},
  title = {Single-Pass Rendering of Day and Night Sky Phenomena},
  booktitle = {Proceedings of the Vision, Modeling, and Visualization Workshop},
  year = {2012},
  series = {VMV~'12},
  publisher = {Eurographics Association},
  pages = {55--62},
  doi = {10.2312/PE/VMV/VMV12/055-062},
  isbn = {978-3-905673-95-1},
}
Photorealistisches Rendering atmosphärischer Effekte in geovirtuellen 3D-Umgebungen in Echtzeit
Master's Thesis in IT-Systems Engineering, Hasso Plattner Institute, 2012Daniel Müller (now Limberger)
Abstract | Master's Thesis [de] | Poster | Source Code
The document was written and is available in German language only.
In this work we present a system for image-synthesis of atmospheric effects in virtual 3d environments. It allows realtime rendering of dynamic, high quality environments for background composition (background scenery) for a variety of applications not only in video-games and simulators (e.g., Flight- or vehicle-simulators), but also for architectural and historical visualizations. To ensure ease of integration, only the background associated phenomena are taken into account. Thereby a texture-based, and a simulation-based approach are presented. The texture-based approach targets the imitation of any environment and uses wellknown, texture-based methods with hardly any creative limitations. They are expandable and ideal for applications where, in resprect to the rendering performance, only low capacities can be allocated. The simulation-based, astrophysical approach, in contrast, is based on astronomical algorithms and astrophysical observations. The new models and methods used within this approach, provide the conceptual focus of this work. Both approaches are optimized for rendering dynamic day-night cycles within a single rendering pass and without subsequent processing. They are integrated in a large representative rendering system (OpenSceneGraph). Detailed performance measurements in different scenarios and quality levels show that the system has little effect on overall rendering-speed.
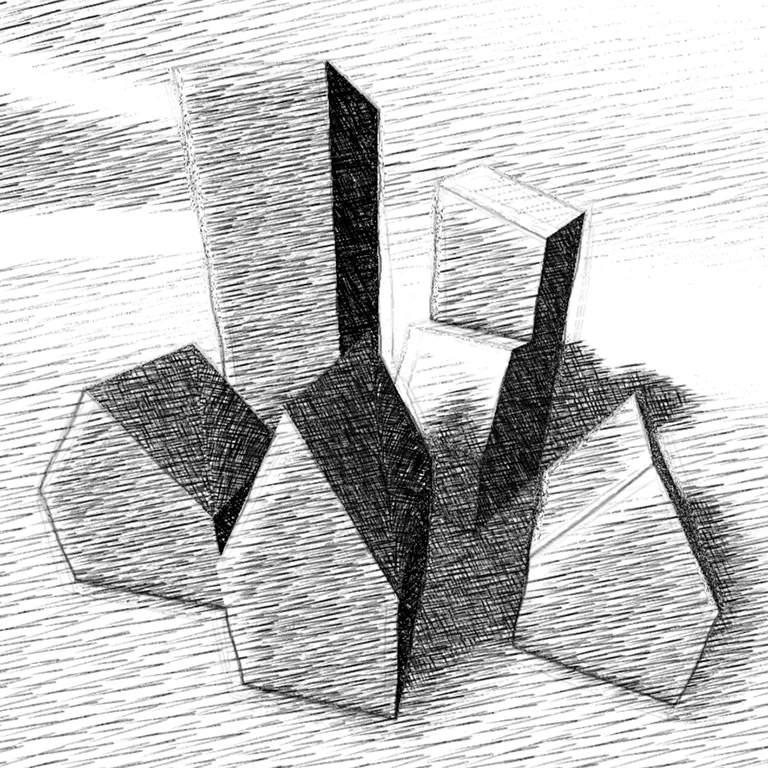
Computergenerierte Bleistiftzeichnungen von 3D-Stadtmodellen
Bachelor's Thesis in IT-Systems Engineering, Hasso Plattner Institute, 2009Daniel Müller (now Limberger)
Abstract | Bachelor's Thesis [de]
This work summarizes techniques for 3D-image synthesis of pencil or crayon drawings of virtual 3D-city-models in real-time. The document was written and is available in German language only.
Diese Arbeit befasst sich mit der Erstellung von Bleistiftzeichnungen dreidimensionaler Modelle in Echtzeit und prüft die Anwendbarkeit auf virtuelle 3D-Stadtmodelle. Bisherige Verfahren gehen kaum auf stilprägende subjektive Einflüsse der Zeichner ein. So werden stilrelevante Maßnahmen wie weiche Schatten und Lichteinflüsse durch Umgebungsverdeckung häufig vernachlässigt. Nach einer kurzen Zusammenfassung bisheriger Ansätze zur Nachahmung von Bleistiftzeichnungen, werden effiziente Implementierung für Konturdarstellung und Krümmungsapproximation zur Schraffur vorgestellt. Da die meisten Berechnungen diskretisiert im Bildraum vorgenommen werden, entstehen beim Rendern komplexer 3D-Stadtmodelle störende, mit der Tiefe zunehmende Artefakte. Zur Abschwächung dieser Störfaktoren werden praktische Lösungen wie stilkonforme Tiefenfokussierung diskutiert.