
Dr. Daniel
Limberger
Graphics Systems Engineer
— Visual Analytics Researcher

Graphics Systems Engineer
— Visual Analytics Researcher
Daniel Limberger
Abstract | BibTeX | DOI | Doctoral Thesis
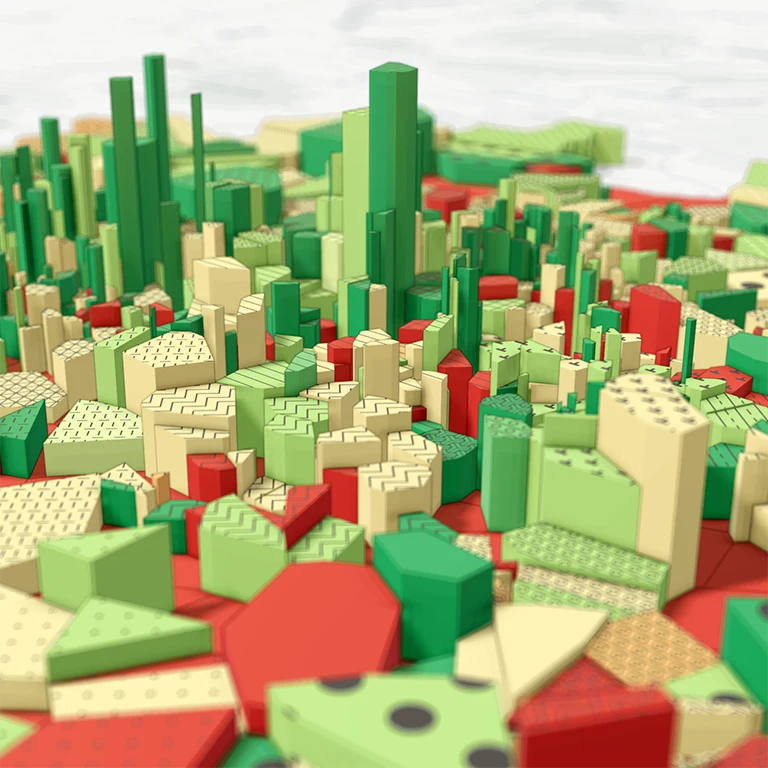
This thesis addresses concepts and techniques for interactive visualization of hierarchical data using treemaps. It explores (1) how treemaps can be embedded in 3D space to improve their information content and expressiveness, (2) how the readability of treemaps can be improved using level-of-detail and degree-of-interest techniques, and (3) how to design and implement a software framework for the real-time web-based rendering of treemaps embedded in 3D. With a particular emphasis on their application, use cases from software analytics are taken to test and evaluate the presented concepts and techniques.
Concerning the first challenge, this thesis shows that a 3D attribute space offers enhanced possibilities for the visual mapping of data compared to classical 2D treemaps. In particular, embedding in 3D allows for improved implementation of visual variables (e.g., by sketchiness and color weaving), provision of new visual variables (e.g., by physically based materials and in situ templates), and integration of visual metaphors (e.g., by reference surfaces and renderings of natural phenomena) into the three-dimensional representation of treemaps.
For the second challenge—the readability of an information visualization—the work shows that the generally higher visual clutter and increased cognitive load typically associated with three-dimensional information representations can be kept low in treemap-based representations of both small and large hierarchical datasets. By introducing an adaptive level-of-detail technique, we cannot only declutter the visualization results, thereby reducing cognitive load and mitigating occlusion problems, but also summarize and highlight relevant data. Furthermore, this approach facilitates automatic labeling, supports the emphasis on data outliers, and allows visual variables to be adjusted via degree-of-interest measures.
The third challenge is addressed by developing a real-time rendering framework with WebGL and accumulative multi-frame rendering. The framework removes hardware constraints and graphics API requirements, reduces interaction response times, and simplifies high-quality rendering. At the same time, the implementation effort for a web-based deployment of treemaps is kept reasonable.
The presented visualization concepts and techniques are applied and evaluated for use cases in software analysis. In this domain, data about software systems, especially about the state and evolution of the source code, does not have a descriptive appearance or natural geometric mapping, making information visualization a key technology here. In particular, software source code can be visualized with treemap-based approaches because of its inherently hierarchical structure. With treemaps embedded in 3D, we can create interactive software maps that visually map, software metrics, software developer activities, or information about the evolution of software systems alongside their hierarchical module structure.
Discussions on remaining challenges and opportunities for future research for 3D-embedded treemaps and their applications conclude the thesis.
@phdthesis{limberger2024-embedded-treemaps,
  author = {Daniel Limberger},
  title = {Concepts and techniques for 3D-embedded treemaps and their application to software visualization},
  type = {doctoralthesis},
  pages = {xi, 118},
  school = {Universit{\"a}t Potsdam},
  doi = {10.25932/publishup-63201},
  year = {2024},
}
Daniel Limberger, Willy Scheibel, Jürgen Döllner, and Matthias Trapp
Abstract | BibTeX | DOI | Paper
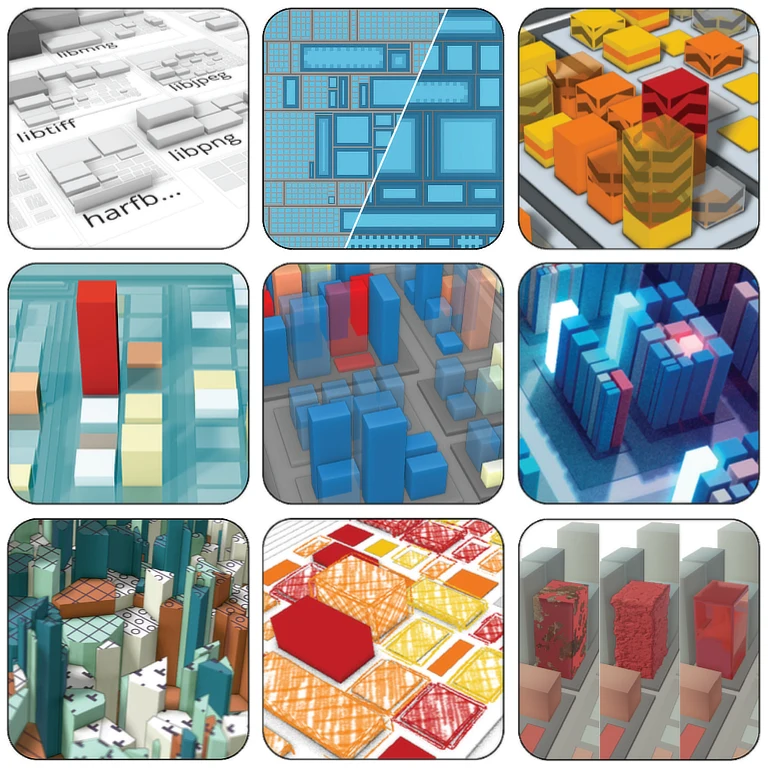
Software maps provide a general-purpose interactive user interface and information display in software analytics. This paper classifies software maps as a containment-based treemap embedded into a 3D attribute space and introduces respective terminology. It provides a comprehensive overview of advanced visual metaphors and techniques, each suitable for interactive visual analytics tasks. The metaphors and techniques are briefly described, located within a visualization pipeline model, and considered within a software map design space. The general expressiveness and applicability of visual variables are detailed and discussed. Consequent applications and use cases for different software system data and software engineering data are discussed, arguing for the versatile use of software maps in visual software analytics.
@article{limberger2022-visvars,
  author = {Limberger, Daniel and Scheibel, Willy and D{\"o}llner, J{\"u}rgen and Trapp, Matthias},
  title = {Visual Variables and Configuration of Software Maps},
  journal = {Journal of Visualization},
  year = {2022},
  publisher = {Springer Nature},
  doi = {10.1007/s12650-022-00868-1},
}
Bastian König, Daniel Limberger, Jan Klimke, Benjamin Hagedorn, and Jürgen Döllner
Abstract | BibTeX | DOI | Paper | Demo
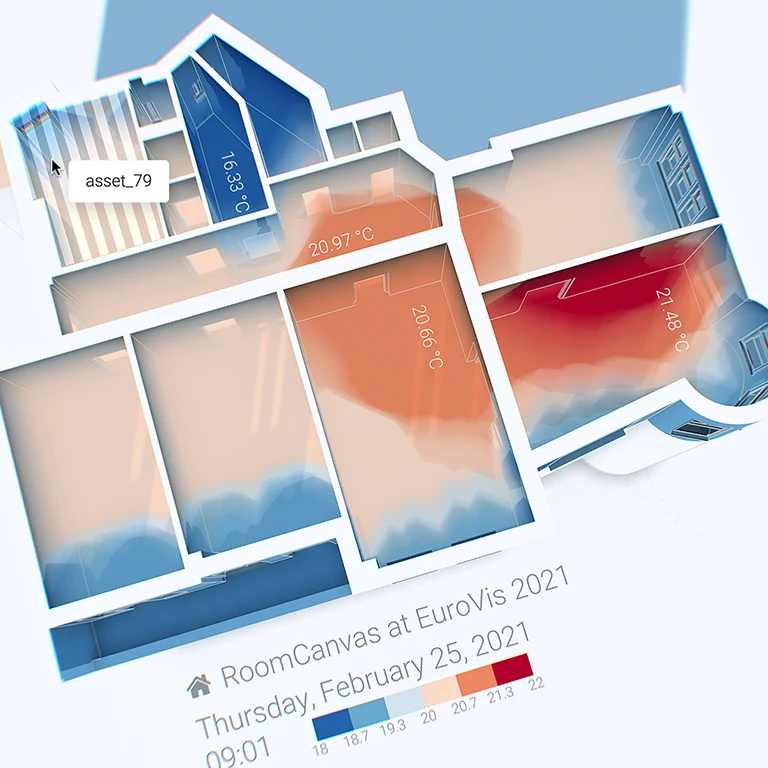
Spatiotemporal measurements such as power consumption, temperature, humidity, movement, noise, brightness, etc., will become ubiquitously available in both old and modern homes to capture and analyze behavioral patterns. The data is fed into analytics platforms and tapped by services but is generally not readily available to consumers for exploration due in part to its inherent complexity and volume. We present an interactive visualization system that uses a simplified 3D representation of building interiors as a canvas for a unified sensor data display. The system’s underlying visualization supports spatial as well as temporal accumulation of data, e.g., temperature and humidity values. It introduces a volumetric data interpolation approach which takes 3D room boundaries such as walls, doors, and windows into account. We showcase an interactive, web-based prototype that allows for the exploration of historical as well as real-time data of multiple temperature and humidity sensors. Finally, we sketch an integrated pipeline from sensor data acquisition to visualization, discuss the creation of semantic geometry and subsequent preprocessing, and provide insights into our real-time rendering implementation.
@inproceedings{koenig2021-roomcanvas,
  author = {K{\"o}nig, Bastian and Limberger, Daniel and Klimke, Jan and Hagedorn, Benjamin and D{\"o}llner, J{\"u}rgen},
  title = {RoomCanvas: A Visualization System for Spatiotemporal Temperature Data in Smart Homes},
  booktitle = {EuroVis 2021 - Short Papers},
  year = {2021},
  series = {EuroVis~'21},
  publisher = {EG},
  pages = {13--17},
  doi = {10.2312/evs.20211048},
  isbn = {978-3-038681-43-4},
}
Daniel Limberger
Abstract | BibTeX | Patent | USPTO
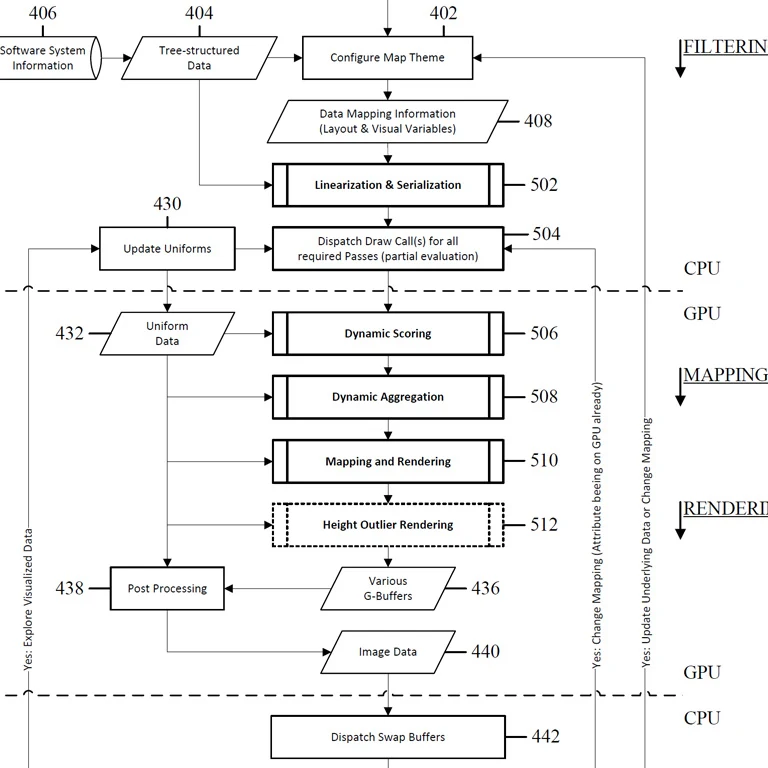
An aggregation approach allows for a dynamic, interactive, adaptive level-of-detail for 2D, 2.5D, and 3D treemaps for visualization of complex information. For example, the 2.5D treemap visualization concept is extended by providing adaptive identification of aggregates by means of an interactive node scoring approach based on contextual relevance and various other task, interaction, visibility, and/or performance specific criteria. For the resulting mapping and rendering, a per-frame aggregation of blocks and accumulation of those attributes mapped to visual variables (context) is described. Since every embodiment is also targeted for dynamic, interactive visual display of 2.5D treemaps, the rendering is designed to be capable for execution in real-time. Visual preservation of important information is conveyed by hierarchy elements and their mapped attributes (nodes-of-interest) as well as compliance to known aggregation guidelines including visualization of aggregated color and height information, visualization of aggregates that are discernible from non-aggregates, and visualization of outliers within aggregates. Applications include visualization of software maps, business intelligence data, file hierarchies for storage devices, and the like.
@patent{limberger2018-lod-patent,
  title = {Interactive, Adaptive Level-of-Detail in 2.5 D Treemaps},
  author = {Limberger, Daniel},
  year = {2018},
  date = {2018-04-24},
  number = {9953443},
  holder = {Seerene GmbH},
  type = {patentus},
}
Daniel Limberger, Marcel Pursche, Jan Klimke, and Jürgen Döllner
Abstract | BibTeX | DOI | Paper
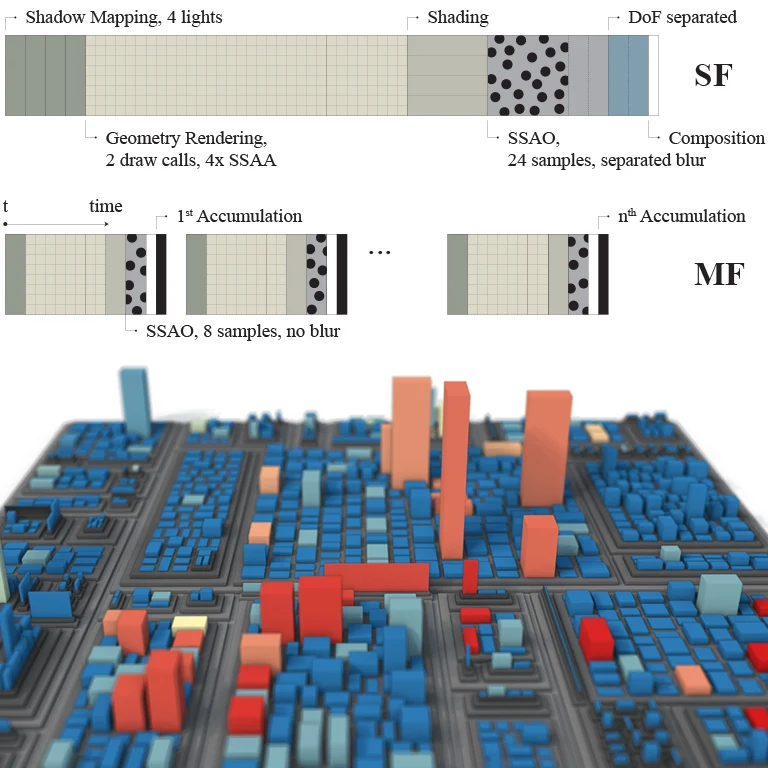
Information cartography services provided via web-based clients using real-time rendering do not always necessitate a continuous stream of updates in the visual display. This paper shows how progressive rendering by means of multi-frame sampling and frame accumulation can introduce high-quality visual effects using robust and straightforward implementations. For it, (1) a suitable rendering loop is described, (2) WebGL limitations are discussed, and (3) an adaption of THREE.js featuring progressive anti-aliasing, screen-space ambient occlusion, and depth of field is detailed. Furthermore, sampling strategies are discussed and rendering performance is evaluated, emphasizing the low per-frame costs of this approach.
@inproceedings{limberger2017-progressive,
  author = {Limberger, Daniel and Pursche, Marcel and Klimke, Jan and D{\"o}llner, J{\"u}rgen},
  title = {Progressive High-quality Rendering for Interactive Information Cartography using WebGL},
  booktitle = {Proceedings of the 22nd International Conference on 3D Web Technology},
  year = {2017},
  series = {Web3D~'17},
  publisher = {ACM},
  pages = {8:1--4},
  doi = {10.1145/3055624.3075951},
  isbn = {978-1-450349-55-0},
}
Daniel Limberger, Karsten Tausche, Johannes Linke, and Jürgen Döllner
This chapter presents an approach that distributes sampling over multiple, consecutive frames, and, thereby, enables sampling-based, real-time rendering techniques to be implemented for most graphics hardware and systems in a less complex, straightforward way. This systematic, extensible schema allows developers to effectively handle the increasing implementation complexity of advanced, sophisticated, real-time rendering techniques, while improving responsiveness and reducing required hardware resources.
@article{limberger2016-multi-frame-sampling-pro,
  author = {Limberger, Daniel and Tausche, Karsten and Linke, Johannes and D{\"o}llner, J{\"u}rgen},
  title = {Progressive Rendering using Multi-frame Sampling},
  journal = {GPU Pro 7: Advanced Rendering Techniques},
  year = {2016},
  publisher = {CRC Press},
  pages = {155--173},
  doi = {10.1201/b21261},
  isbn = {978-0-429160-03-5},
}
Amir Semmo, Daniel Limberger, Jan Eric Kyprianidis, and Jürgen Döllner
Abstract | BibTeX | DOI | Paper | Video
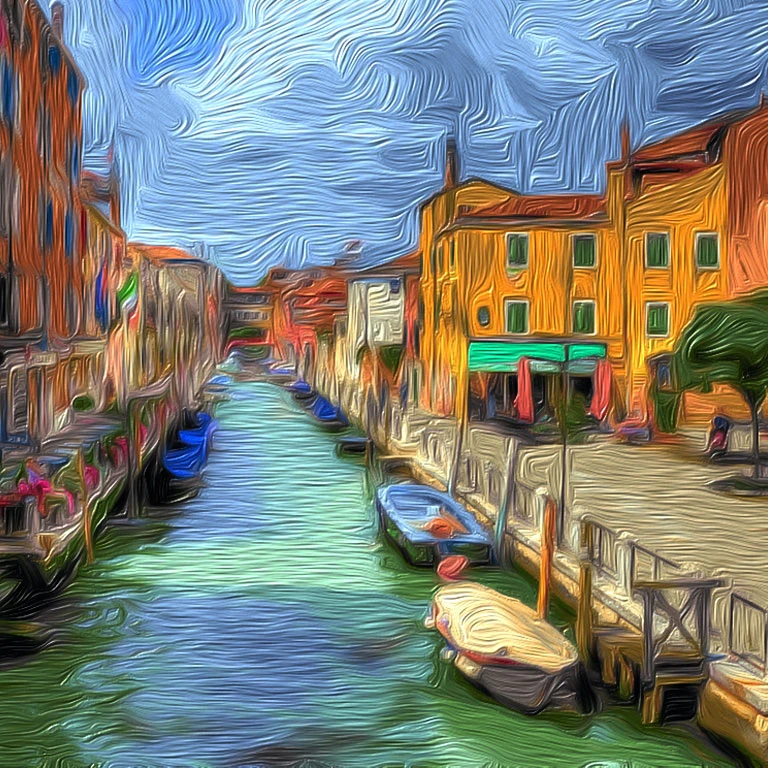
This paper presents an approach for transforming images into an oil paint look. A color quantization scheme is proposed that performs feature-aware recolorization using the dominant colors of the input image. In addition, an approach for real-time computation of paint textures is presented that builds on the smoothed structure adapted to the main feature contours of the quantized image. The stylization technique leads to homogeneous outputs in the color domain and enables creative control over the visual output, such as color adjustments and per-pixel parametrizations by means of interactive painting.
@inproceedings{semmo2015-oilpaint-stylization,
  author = {Semmo, Amir and Limberger, Daniel and Kyprianidis, Jan Eric and D{\"o}llner, J{\"u}rgen},
  title = {Image Stylization by Oil Paint Filtering using Color Palettes},
  booktitle = {Proceedings of the Workshop on Computational Aesthetics},
  year = {2015},
  series = {CAE~'15},
  publisher = {Eurographics Association},
  pages = {149--158},
  doi = {10.2312/exp.20151188},
}
Daniel Müller (now Limberger)
Abstract | Master's Thesis [de] | Poster | Source Code
The document was written and is available in German language only.
In this work we present a system for image-synthesis of atmospheric effects in virtual 3d environments. It allows realtime rendering of dynamic, high quality environments for background composition (background scenery) for a variety of applications not only in video-games and simulators (e.g., Flight- or vehicle-simulators), but also for architectural and historical visualizations. To ensure ease of integration, only the background associated phenomena are taken into account. Thereby a texture-based, and a simulation-based approach are presented. The texture-based approach targets the imitation of any environment and uses wellknown, texture-based methods with hardly any creative limitations. They are expandable and ideal for applications where, in resprect to the rendering performance, only low capacities can be allocated. The simulation-based, astrophysical approach, in contrast, is based on astronomical algorithms and astrophysical observations. The new models and methods used within this approach, provide the conceptual focus of this work. Both approaches are optimized for rendering dynamic day-night cycles within a single rendering pass and without subsequent processing. They are integrated in a large representative rendering system (OpenSceneGraph). Detailed performance measurements in different scenarios and quality levels show that the system has little effect on overall rendering-speed.
Daniel Müller (now Limberger)
Abstract | Bachelor's Thesis [de]
This work summarizes techniques for 3D-image synthesis of pencil or crayon drawings of virtual 3D-city-models in real-time. The document was written and is available in German language only.
Diese Arbeit befasst sich mit der Erstellung von Bleistiftzeichnungen dreidimensionaler Modelle in Echtzeit und prüft die Anwendbarkeit auf virtuelle 3D-Stadtmodelle. Bisherige Verfahren gehen kaum auf stilprägende subjektive Einflüsse der Zeichner ein. So werden stilrelevante Maßnahmen wie weiche Schatten und Lichteinflüsse durch Umgebungsverdeckung häufig vernachlässigt. Nach einer kurzen Zusammenfassung bisheriger Ansätze zur Nachahmung von Bleistiftzeichnungen, werden effiziente Implementierung für Konturdarstellung und Krümmungsapproximation zur Schraffur vorgestellt. Da die meisten Berechnungen diskretisiert im Bildraum vorgenommen werden, entstehen beim Rendern komplexer 3D-Stadtmodelle störende, mit der Tiefe zunehmende Artefakte. Zur Abschwächung dieser Störfaktoren werden praktische Lösungen wie stilkonforme Tiefenfokussierung diskutiert.
For nearly a decade, I have supported and actively steered the teaching efforts within the Computer Graphics Systems Group at the Hasso Plattner Institute. The following shows a summary of selected teaching activities from 2012 to 2022:
| FocusTeaching Focus | RoleActive Role | BachelorBachelors's Program | MasterMasters's Program |
|---|---|---|---|
| Real-time Computer Graphics | Lecturer | ||
| Tutor and/or Co-Lecturer | |||
| Programming & Software Engineering | Tutor and/or Co-Lecturer | ||
| Visualization & Visual Analytics | Tutor and/or Co-Lecturer | ||
| Bachelor's and Master's Projects | Supervisor | ||
| Bachelor's and Master's Theses | Supervisor |
Each bar represents one semester with the evaluation score (given by students) mapped to its height: ≙ 1.0, ≙ 4.0.
Bars colored gray indicate that no evaluation was available, most likely due to an insufficient number of votes.
A revamped projects section, an overview of talks, and a short biography are coming soon.